


Pigsty v2.2 is here! The world’s most powerful PostgreSQL monitoring system receives an epic upgrade — completely rebuilt on Grafana v10, pushing PG observability to a whole new level with a dramatically improved user experience. Live Demo: http://demo.pigsty.cc
This release also introduces a 42-node production simulation sandbox template, adds support for Citus 12 and PG 16 beta2, provides KVM-based Vagrant templates, establishes dedicated Pigsty Yum repos for scattered/hard-to-reach RPM packages, and adds compatibility with UOS20 (a domestic Chinese Linux distribution).
Monitoring Overhaul: Visual Design#
In Pigsty v2.2, the monitoring dashboards were completely rebuilt from scratch, fully leveraging Grafana v10’s new features to deliver a fresh visualization experience.
The most obvious change is color. Pigsty v2.2 adopts a brand-new color scheme. Take the PGSQL Overview dashboard as an example — the new palette uses lower saturation, resulting in a more harmonious and aesthetically pleasing visual experience compared to the previous version.
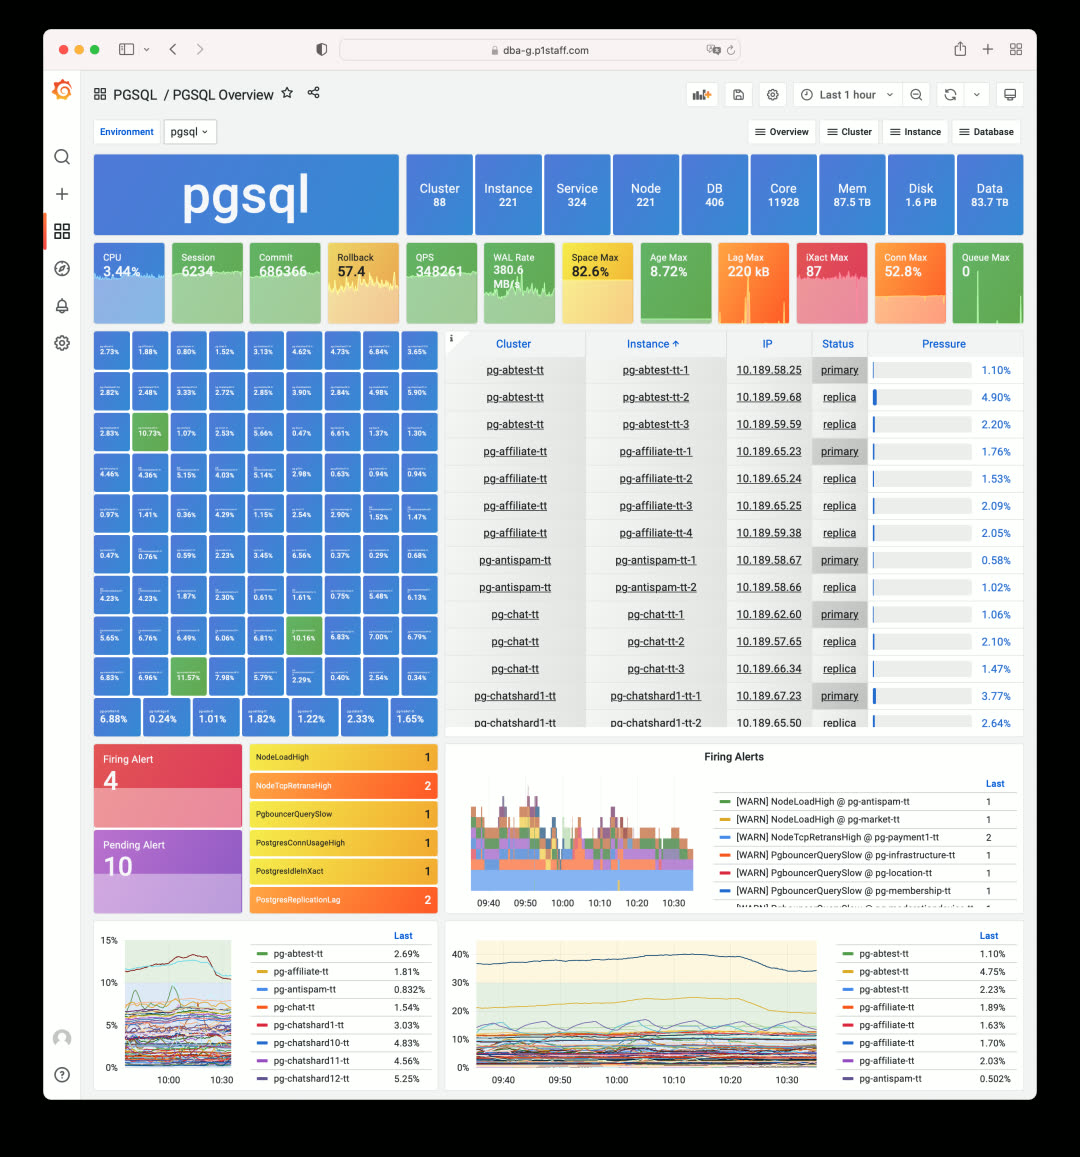
Pigsty v2.0 used Grafana’s default high-saturation colors
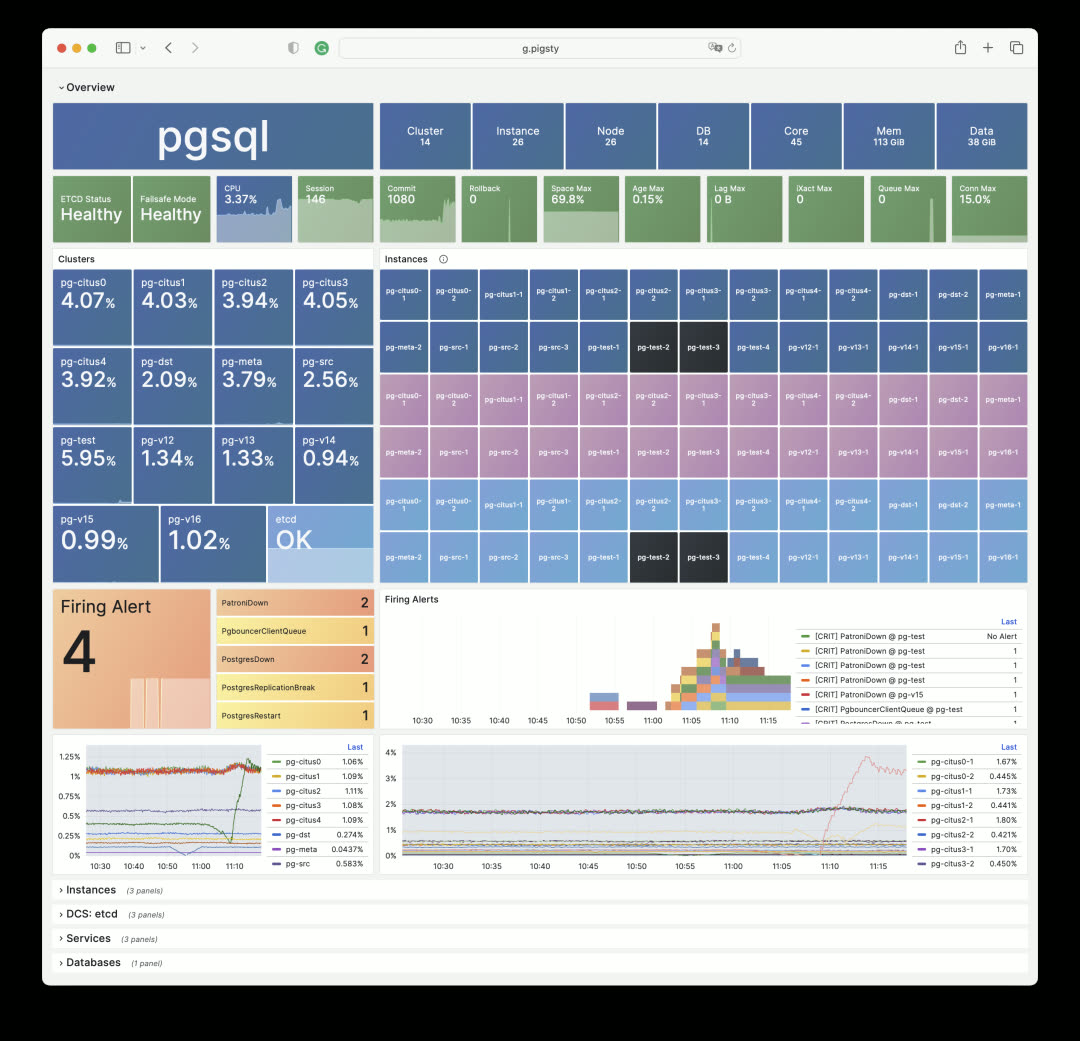
Pigsty v2.2: Failed instances shown in black, click to jump directly to the incident scene
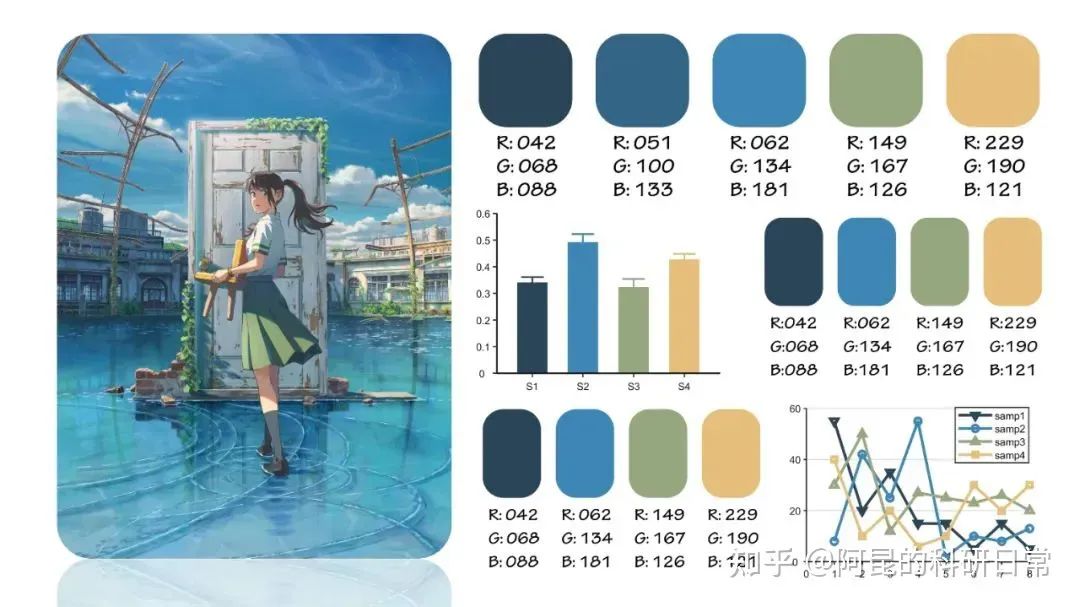
The v2.2 monitoring dashboards use PG Blue, Nginx Green, Redis Red, Python Yellow, and Grafana Orange as the base colors. The inspiration for this color scheme came from an article about applying the color palette from Makoto Shinkai’s “Weathering With You” to scientific paper illustrations.
Monitoring Overhaul: Cluster Navigation#
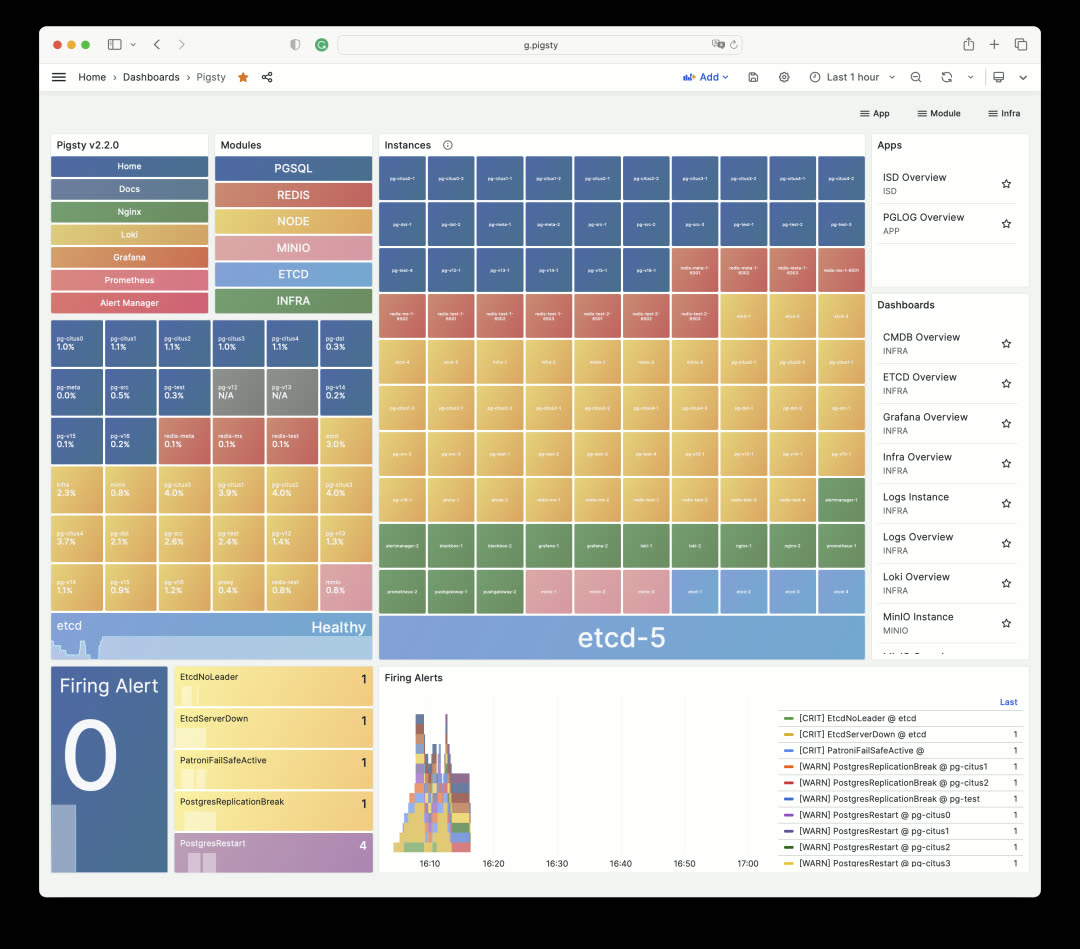
Beyond colors, v2.2 also redesigns content organization and layout. For instance, stats tiles now replace the old table-style navigation, making problematic services immediately visible on the first screen. Click any anomalous tile to jump straight to the incident.
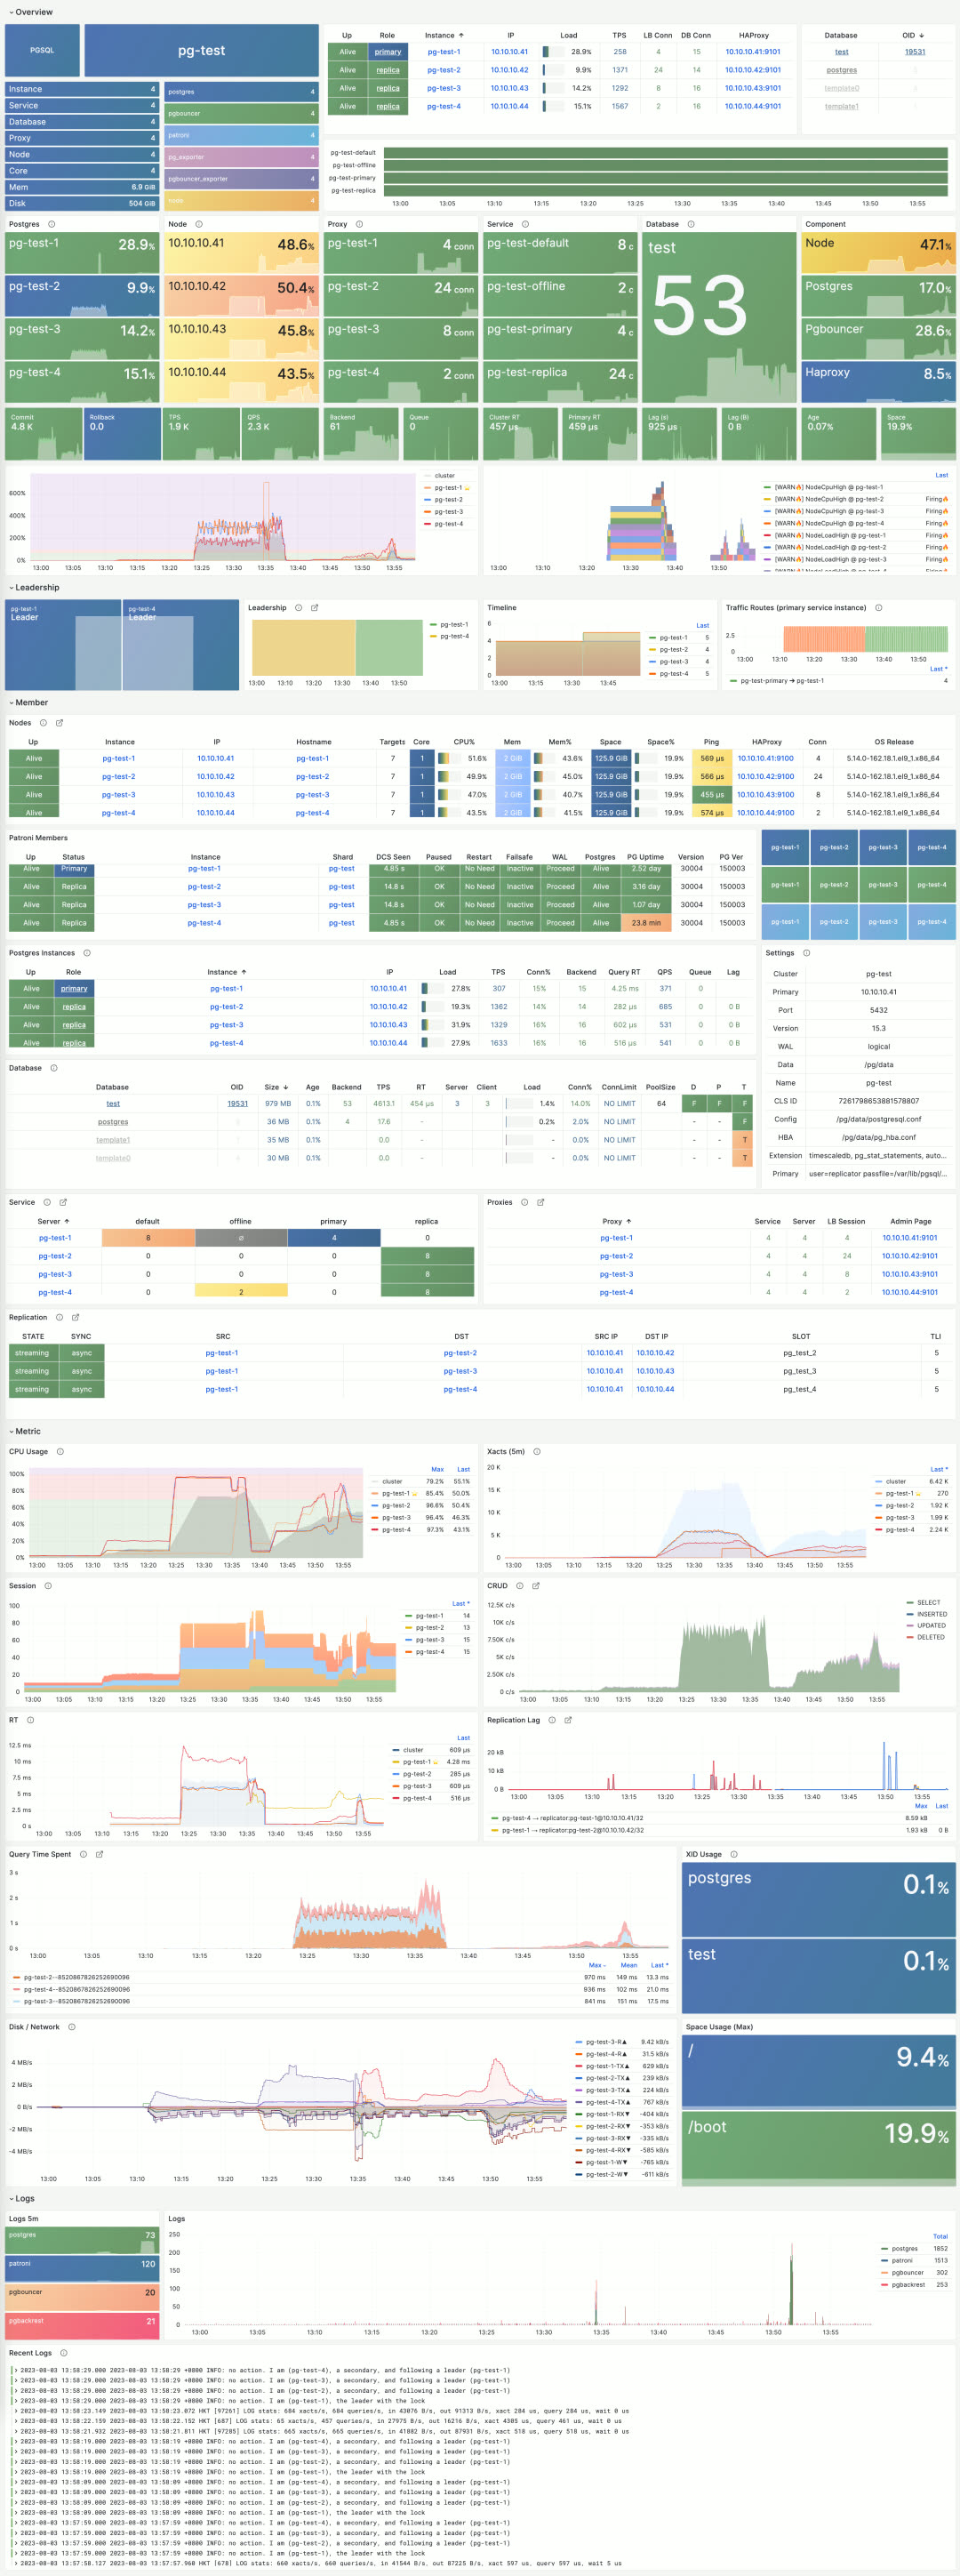
The traditional navigation tables still exist for when you need richer information — they’ve been moved to dedicated Instances / Members sections. Let’s look at the most commonly used PGSQL Cluster dashboard:
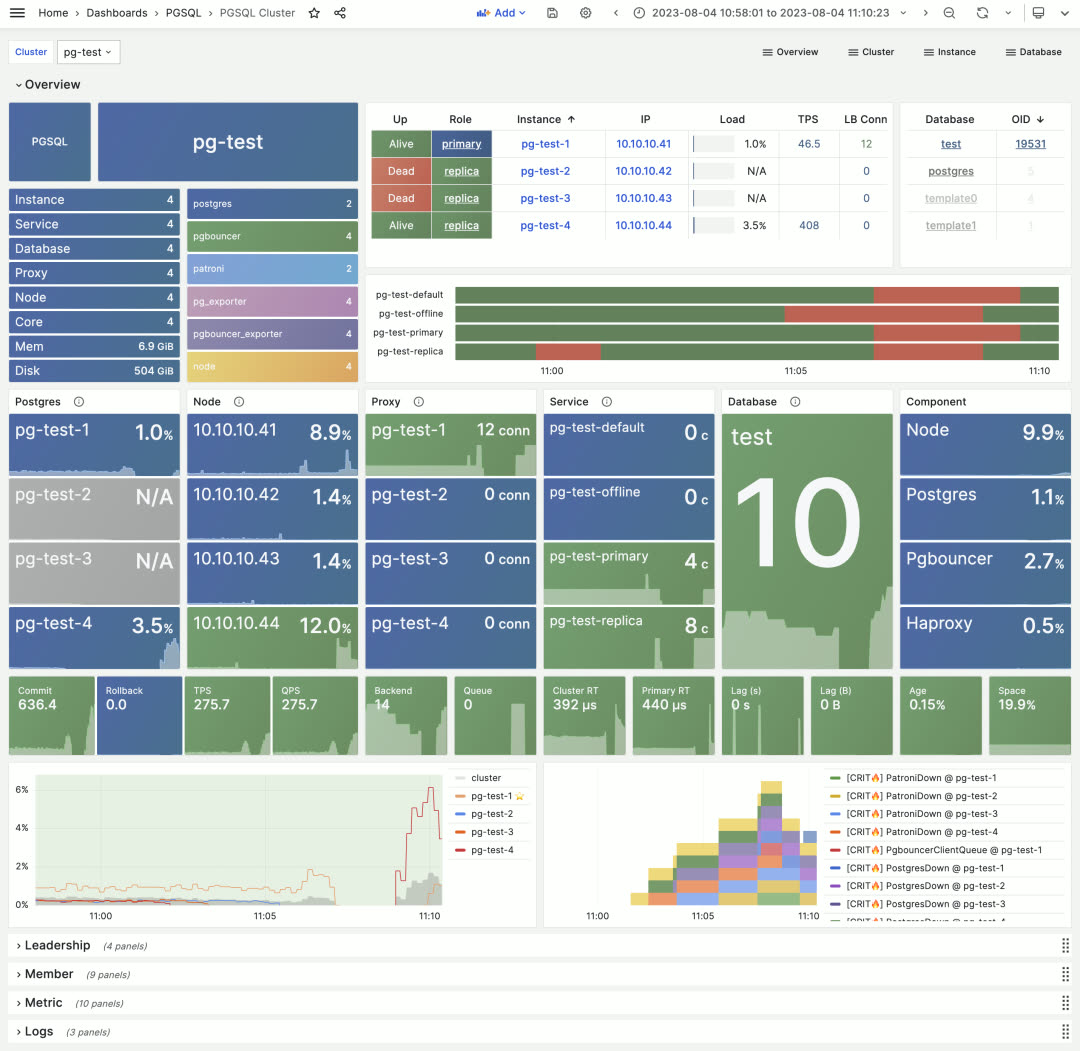
The first screen shows tile-based visual navigation displaying cluster component health and service availability, core metrics, load levels, and alert events. It also provides quick navigation to cluster resources — instances, connection pools, load balancers, services, and databases.
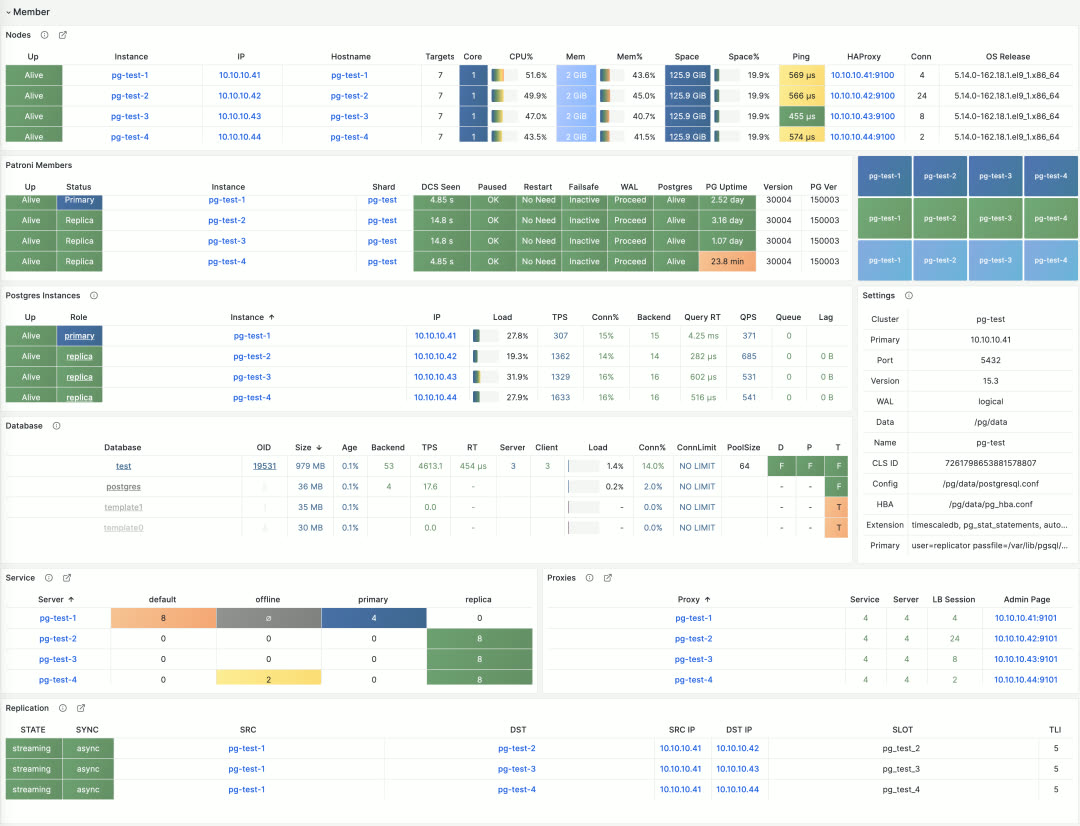
Table-style navigation in PGSQL Cluster
The detailed cluster resource tables appear in the second section for reference. Combined with the metrics and logs sections that follow, it presents a complete picture of a PostgreSQL cluster’s core state.
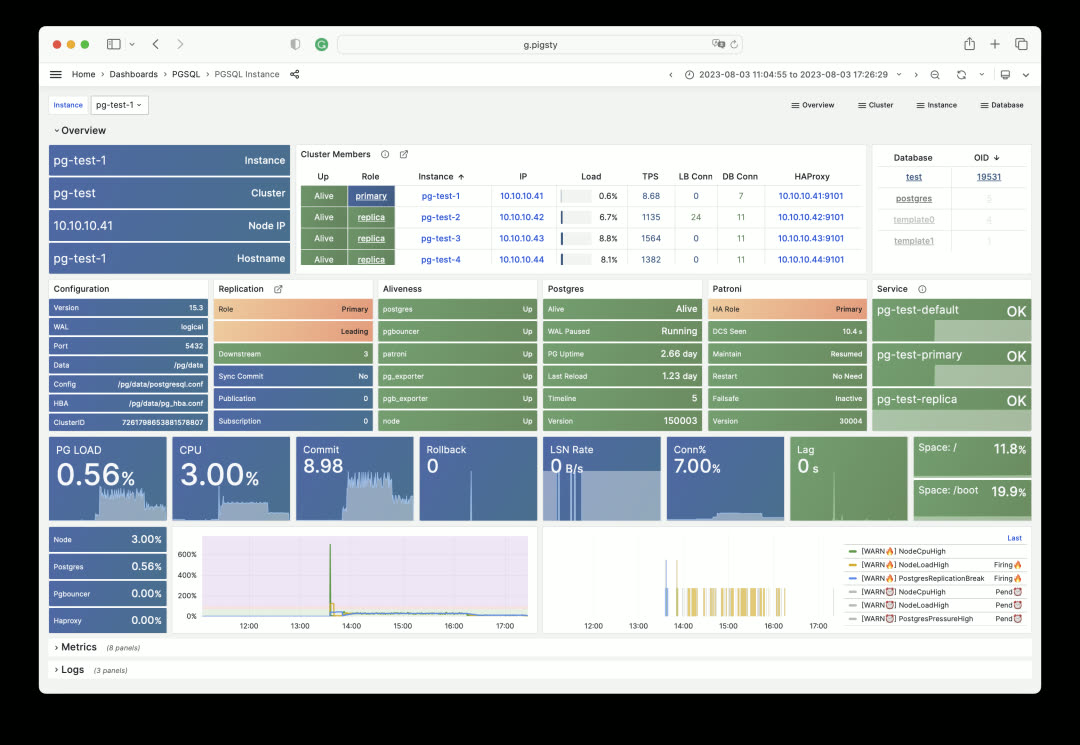
Monitoring Overhaul: Instance View#
PGSQL Instance shows detailed status for a single instance and has also been redesigned in v2.2. The fundamental design principle: only non-blue/green states need attention. Through color-coded visual encoding, users can quickly identify root causes during incident analysis.
Other instances, host nodes, ETCD, MinIO, and Redis all use similar designs. For example, here’s the Node Instance first screen:
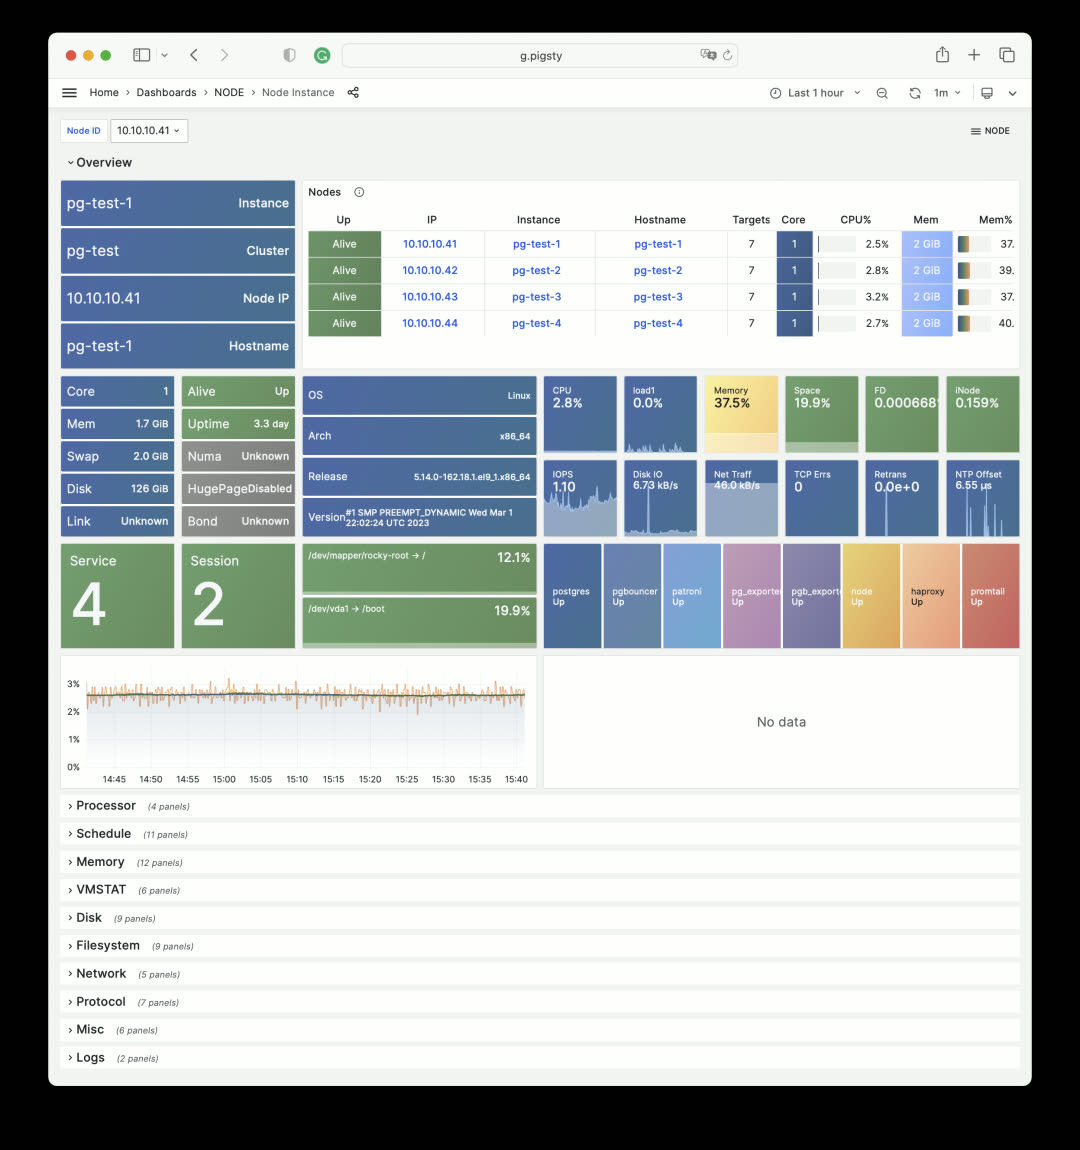
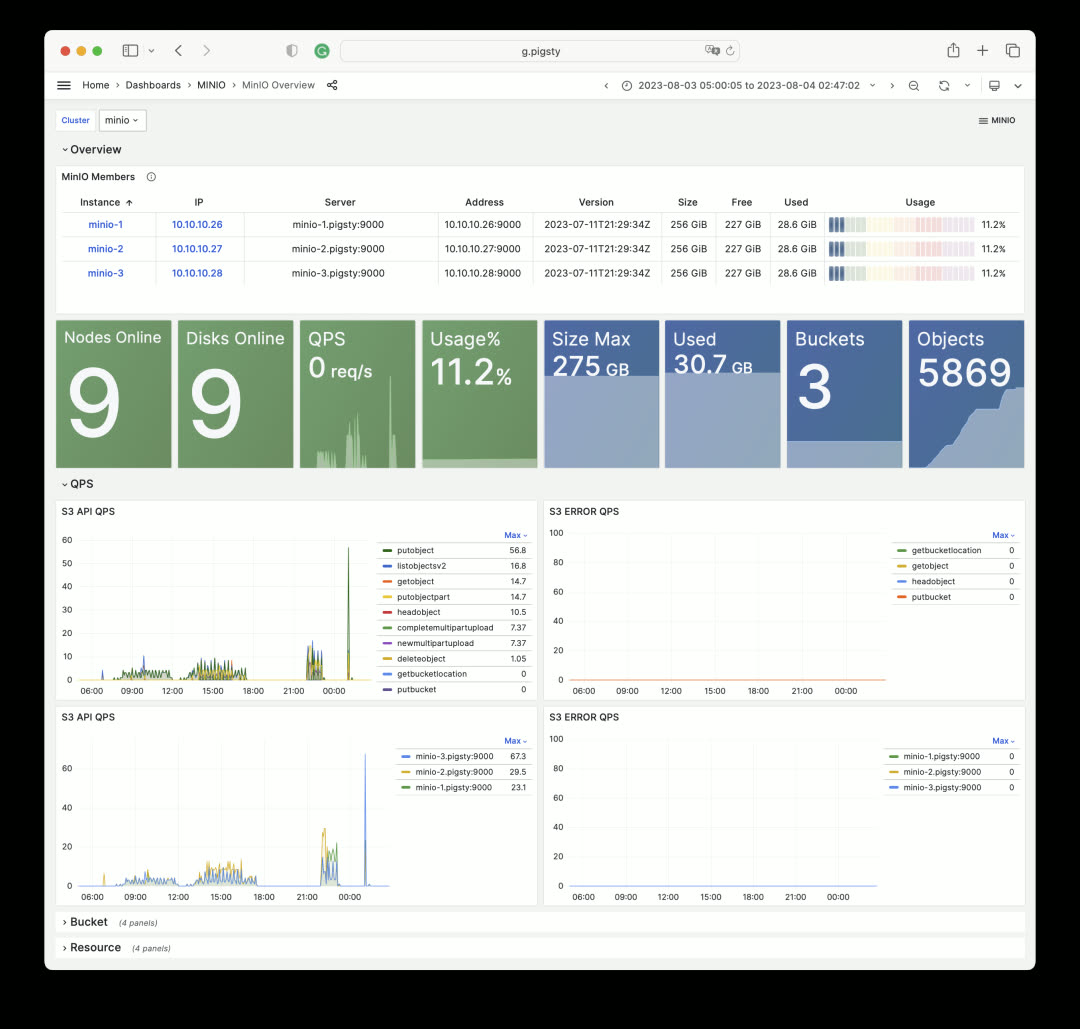
Node Instance metrics remain largely unchanged, but the overview section was redesigned. MinIO Overview follows the same pattern:
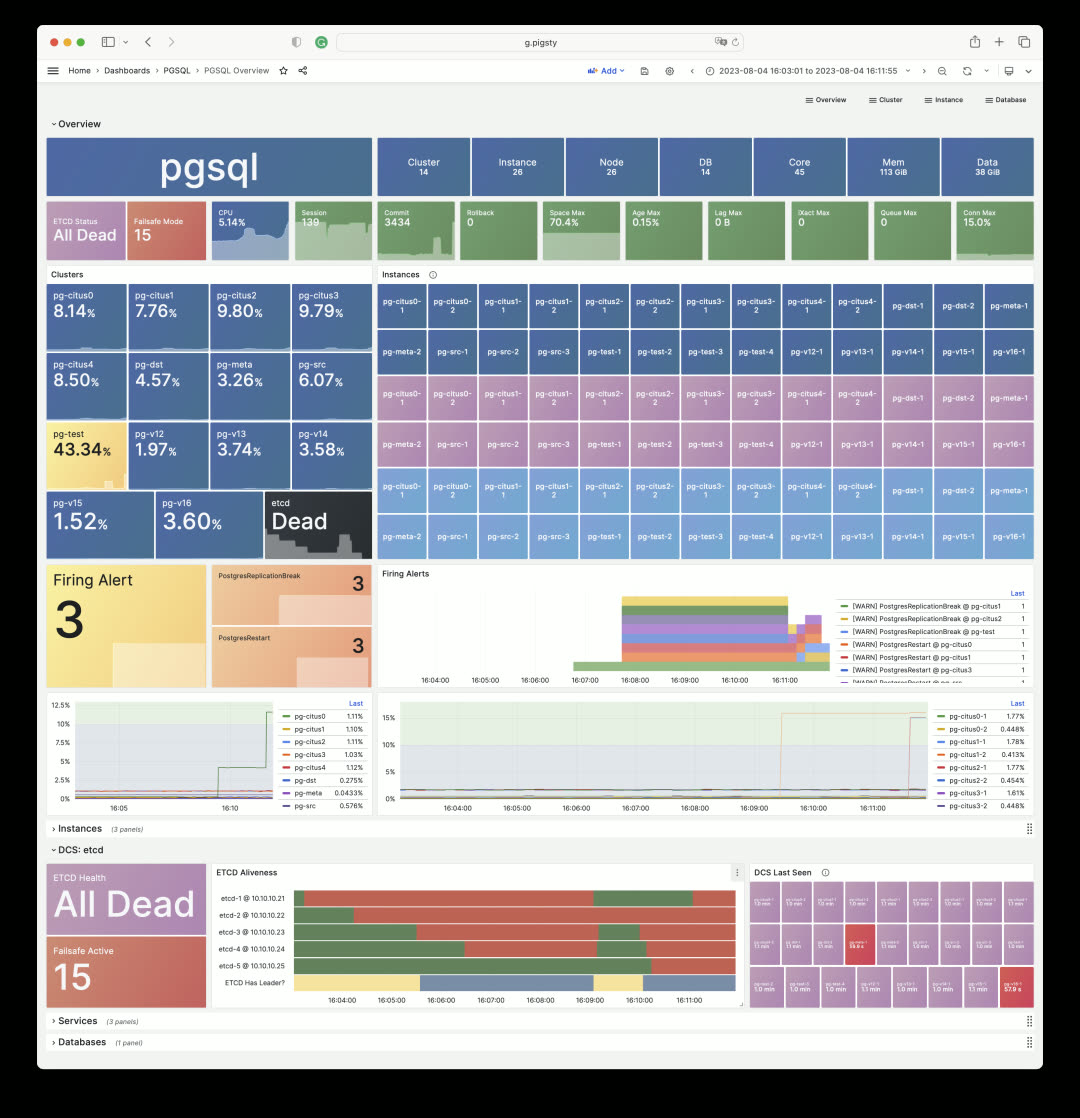
ETCD Overview uses State Timeline to visualize DCS service availability. The image below shows a simulated ETCD failure scenario: instances are shut down one by one in a 5-node ETCD cluster. The cluster tolerates two node failures, but three failures render the entire ETCD service unavailable (yellow bars turn dark blue, indicating overall ETCD service unavailability).

When DCS fails, PostgreSQL clusters relying on ETCD for high availability enable FailSafeMode by default: when all cluster members are reachable and the issue is confirmed to be DCS rather than the instance itself, it prevents unnecessary primary demotion. This status is reflected in PG monitoring:
Monitoring Overhaul: Services#
Another completely redesigned area is Service and Proxy monitoring. The Service dashboard now includes critical service information: SLI. Through State Timeline bars, users can intuitively see service interruptions, obtain availability metrics, and understand the status of load balancers and backend database servers.
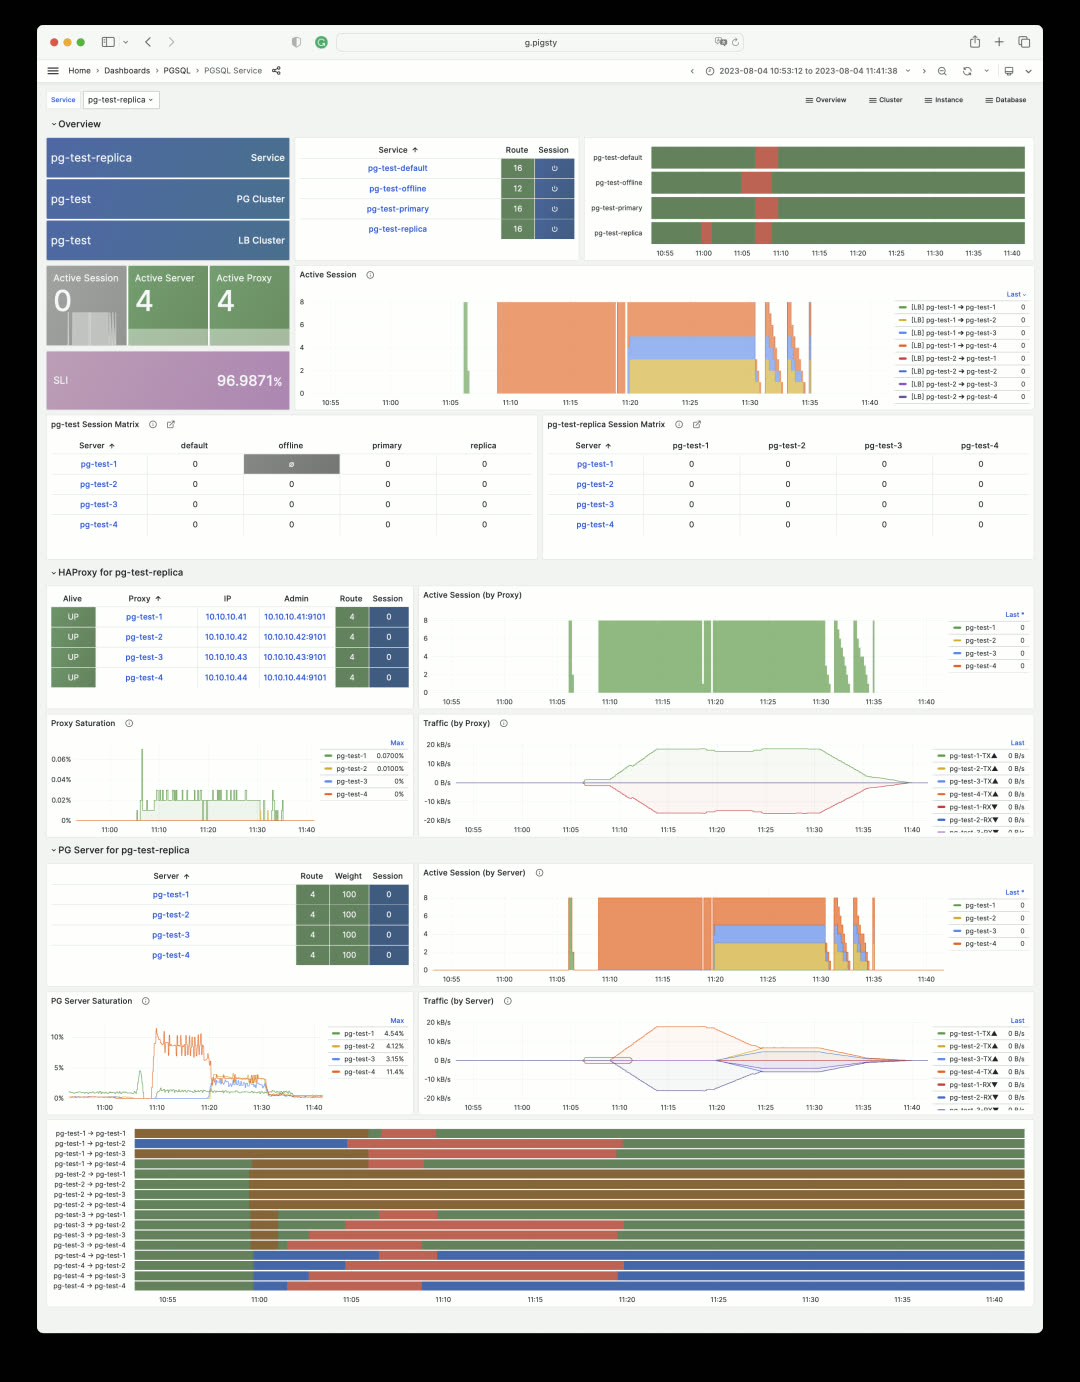
In this example, the four HAProxy instances for the pg-test cluster were drained, put into maintenance mode, then the backend database servers were shut down. The pg-test-replica read service only becomes unavailable when all cluster instances are offline.
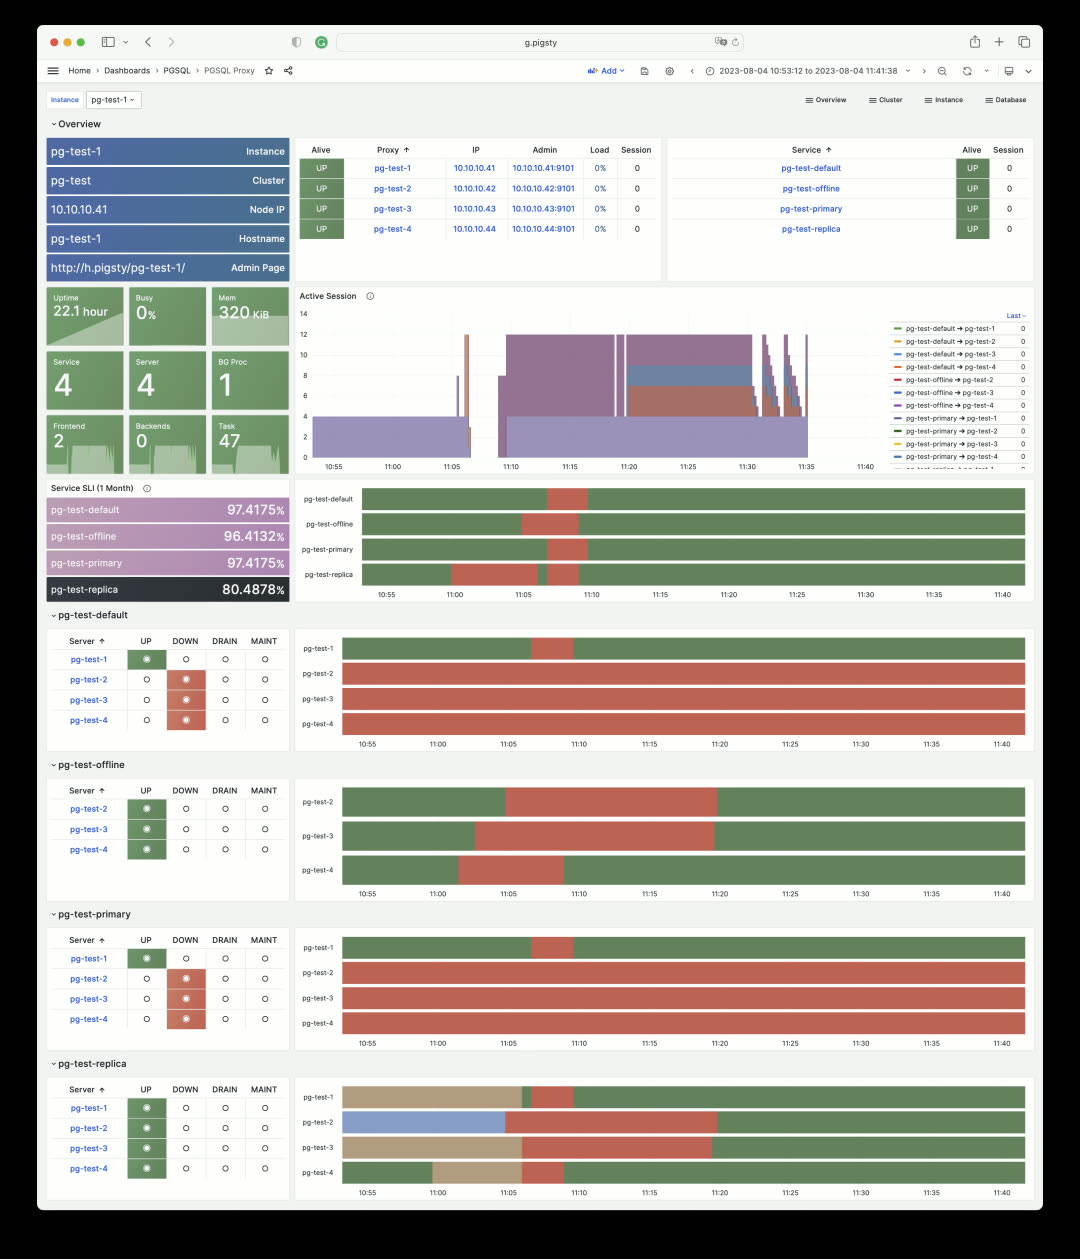
This shows the monitoring dashboard for pg-test cluster’s HAProxy #1 load balancer. Every service it handles is listed, showing backend server status and calculating SLI. HAProxy’s own status and metrics are in the Node Haproxy dashboard.
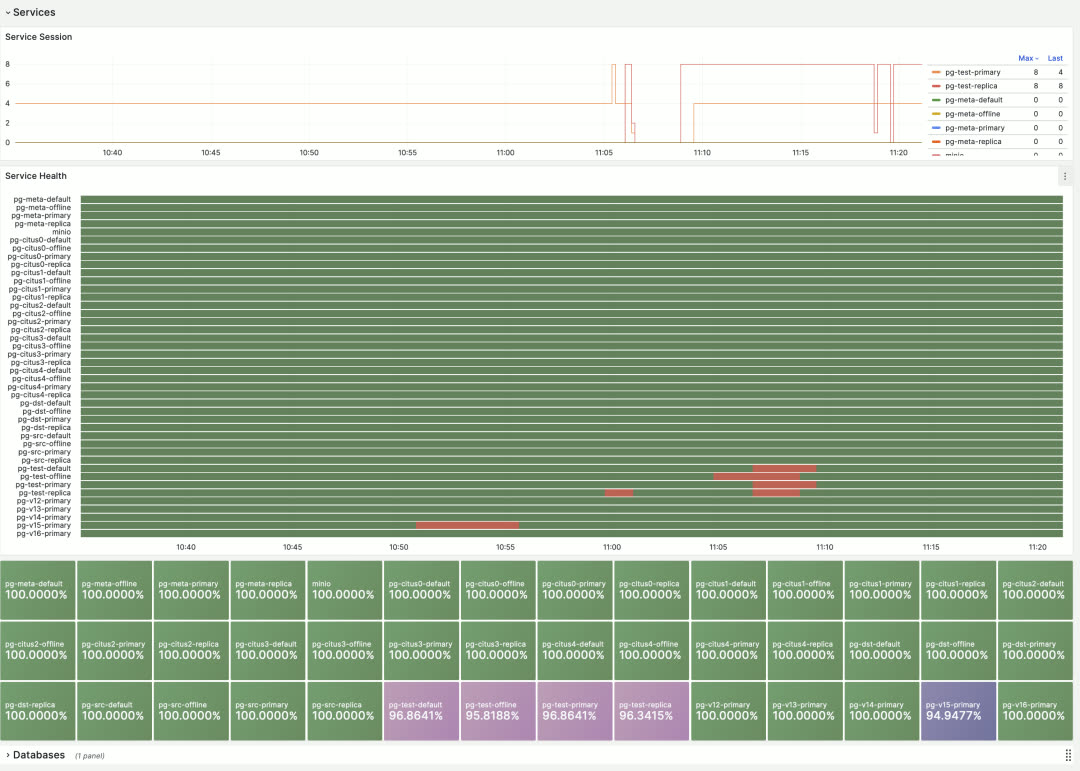
The global overview shows the overall status timeline and SLI metrics for all database services in Pigsty.
Monitoring Overhaul: Database Statistics#
Besides monitoring database servers, Pigsty also monitors the logical objects they host — databases, tables, queries, indexes, and more.
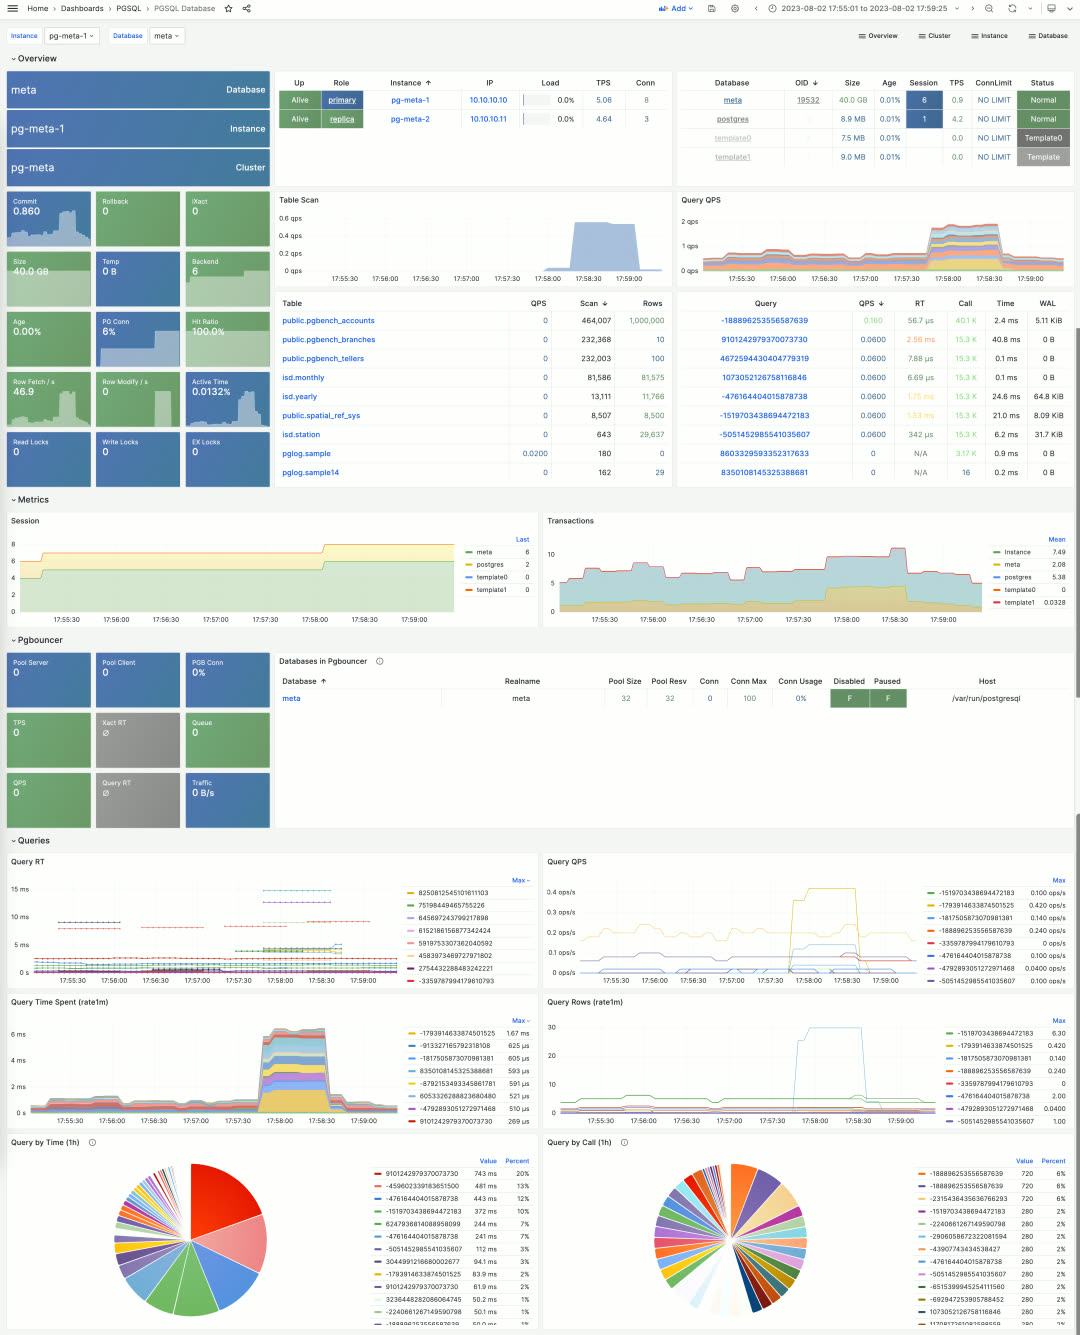
PGSQL Databases shows cluster-level database statistics. For example, the pg-test cluster has 4 database instances and one database called test. This view enables horizontal comparison of database metrics across all 4 instances.
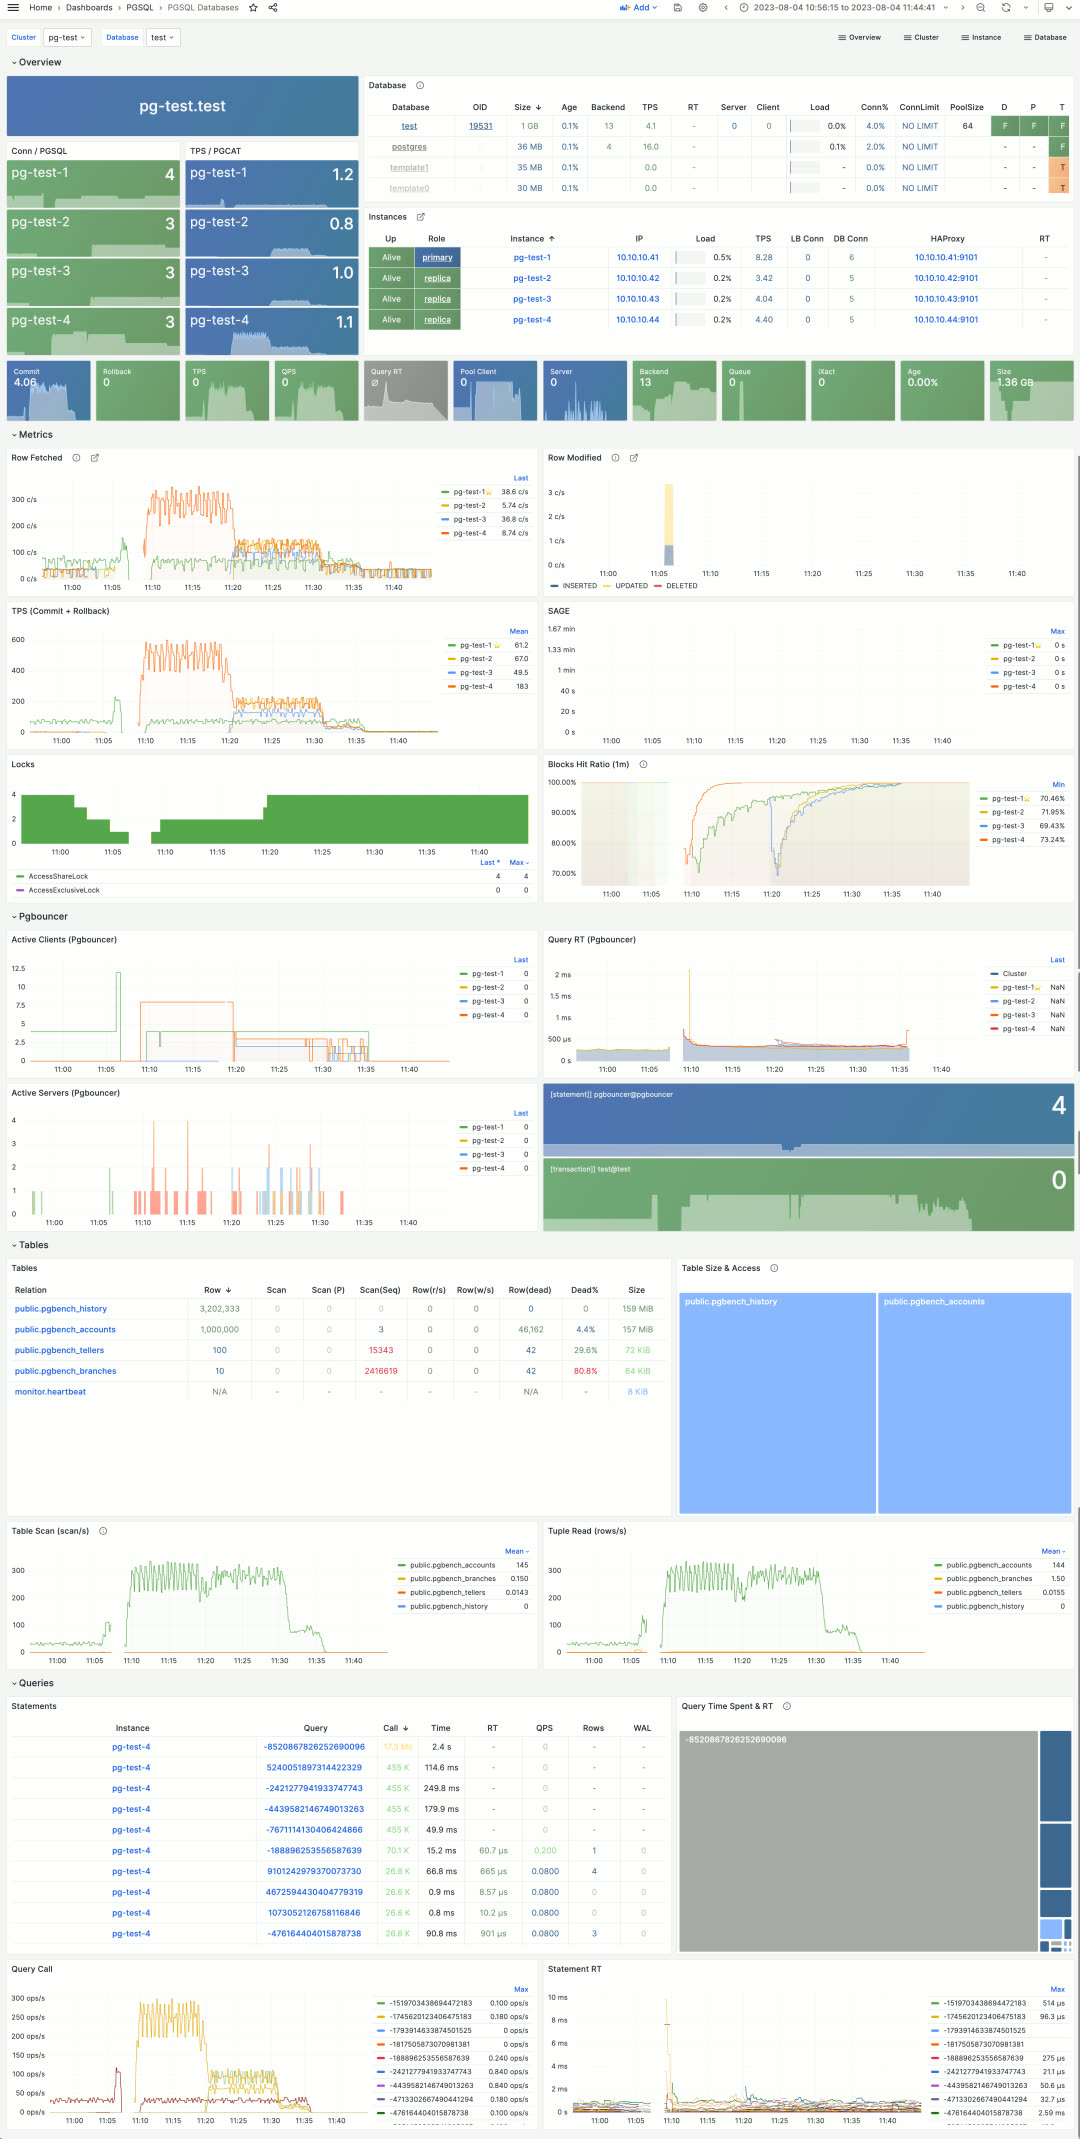
Users can drill down into statistics within a single database instance via the PGSQL Database dashboard. This dashboard provides key metrics about the database and connection pool, but most importantly, it indexes the most active tables and queries — the two most critical in-database objects.
Monitoring Overhaul: System Catalog#
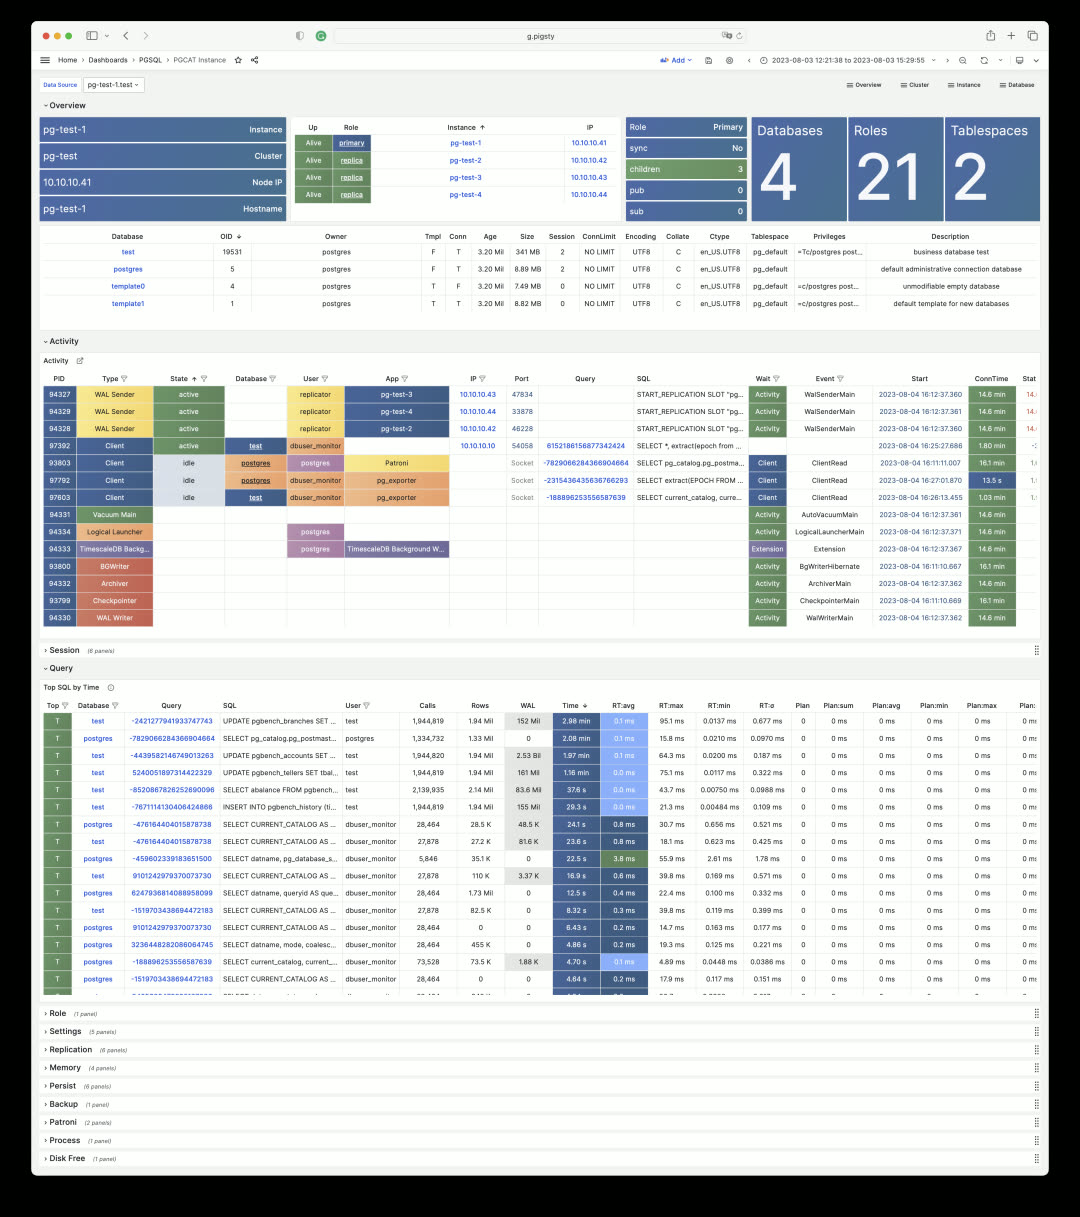
Beyond metrics collected by pg_exporter, Pigsty uses another type of optional supplementary data — system catalogs. This is what the PGCAT dashboard series does. PGCAT Instance directly queries database system catalogs (using at most 8 read-only monitoring connections) to retrieve and present information.
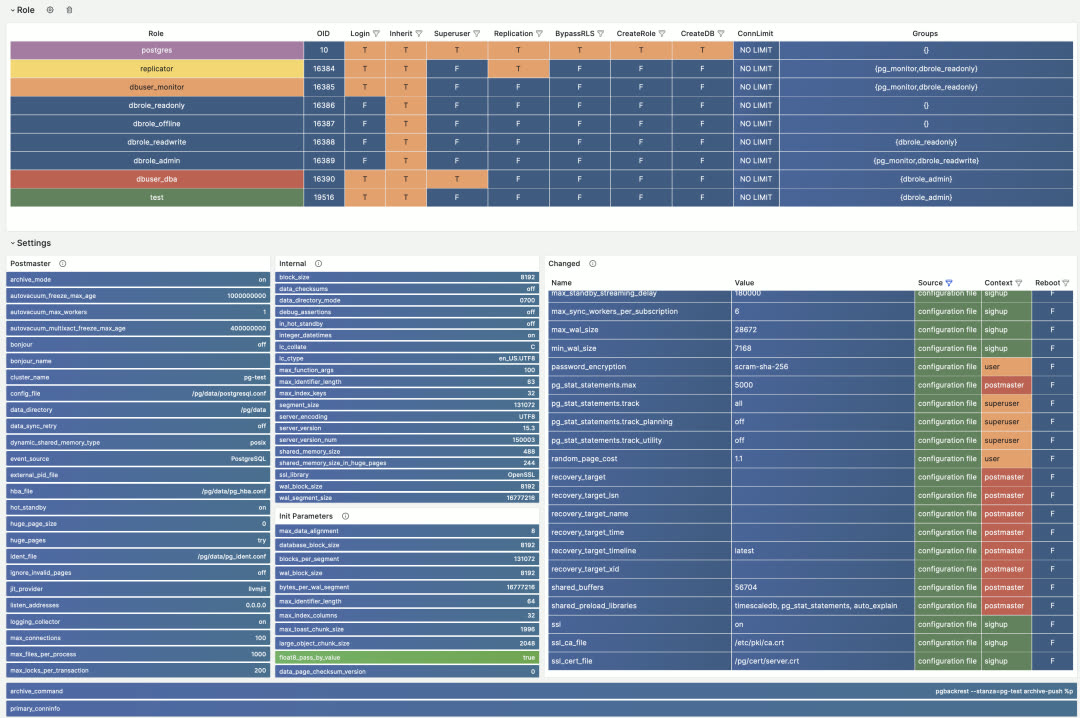
For example, you can get current database activities, locate and analyze slow queries, unused indexes, and sequential scans using various metrics. You can also examine database roles, sessions, replication status, configuration changes, memory usage details, and backup/persistence specifics.
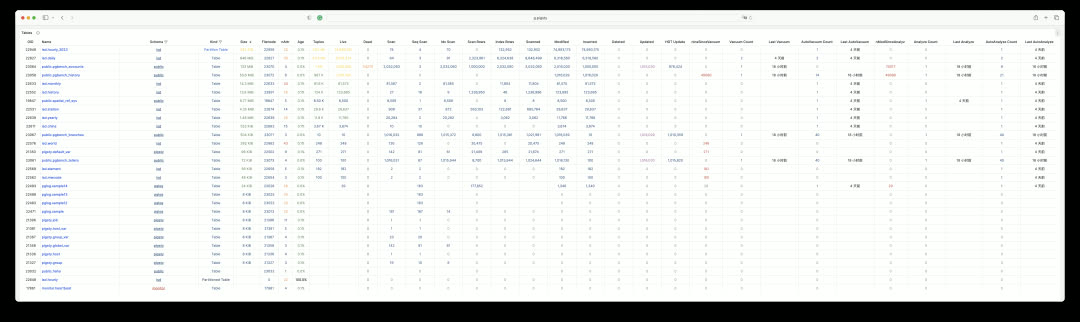
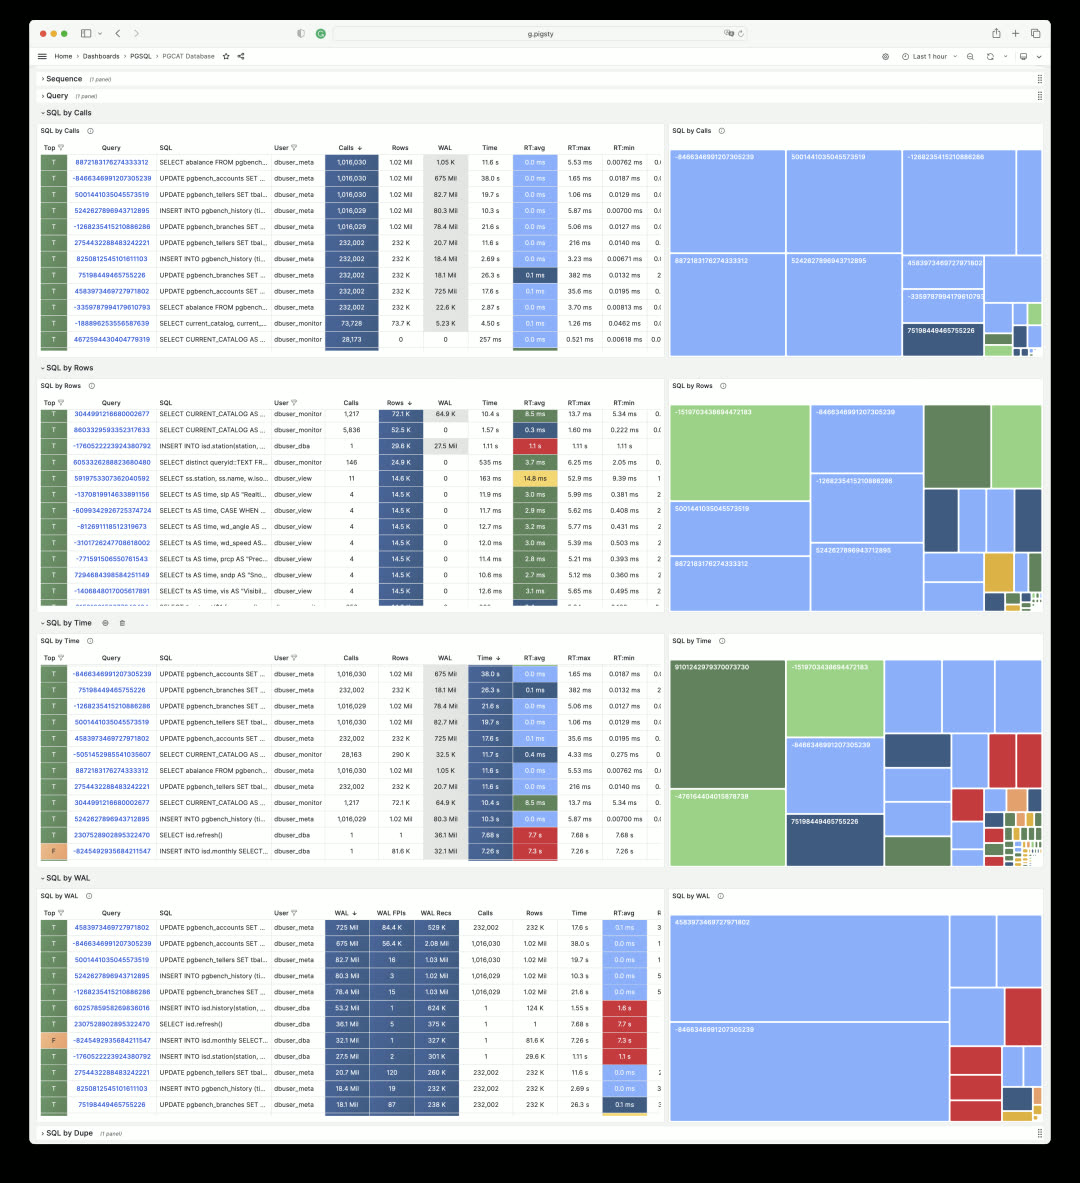
While PGCAT Instance focuses on the database server itself, PGCAT Database focuses on object details within a single database: schemas, tables, indexes, bloat, top SQL, top tables, and more.
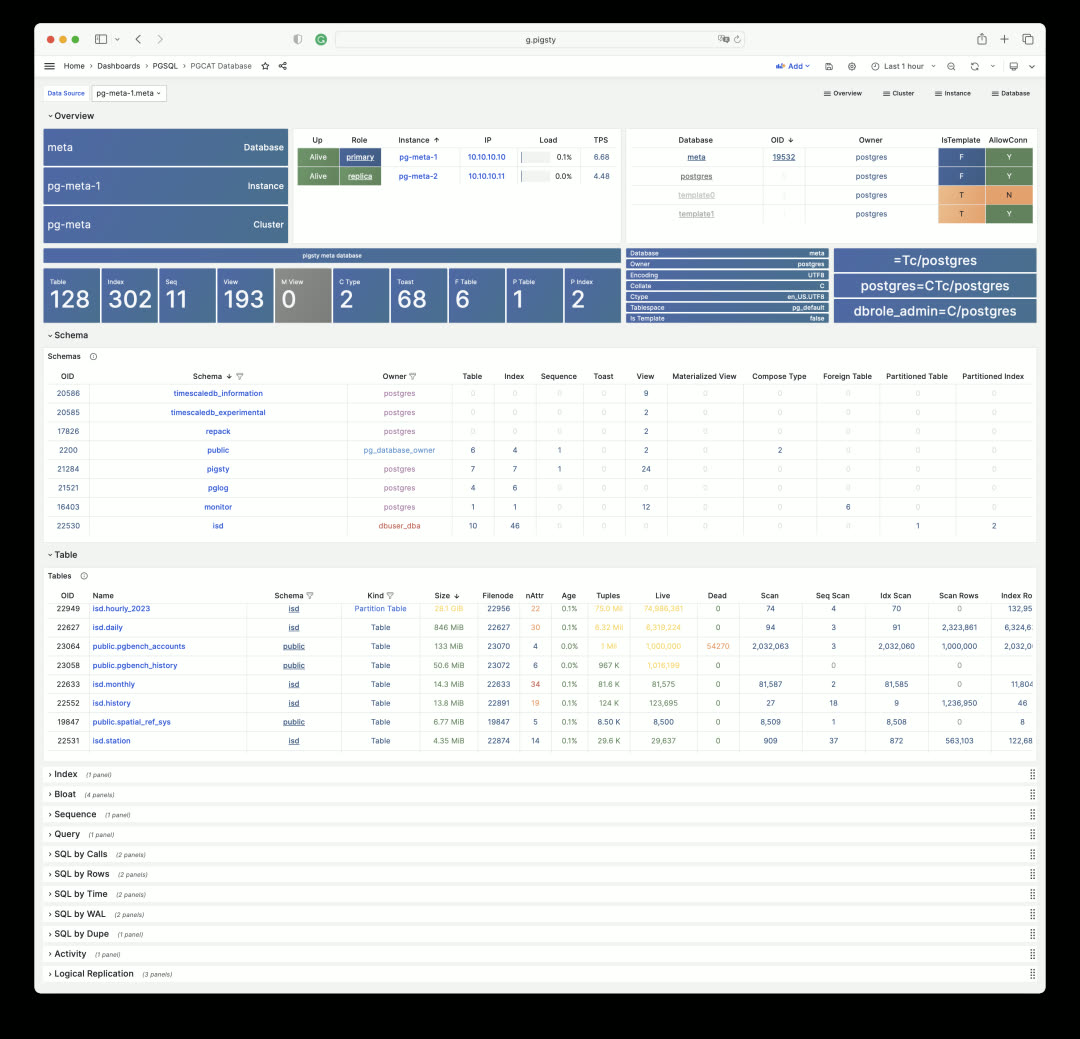
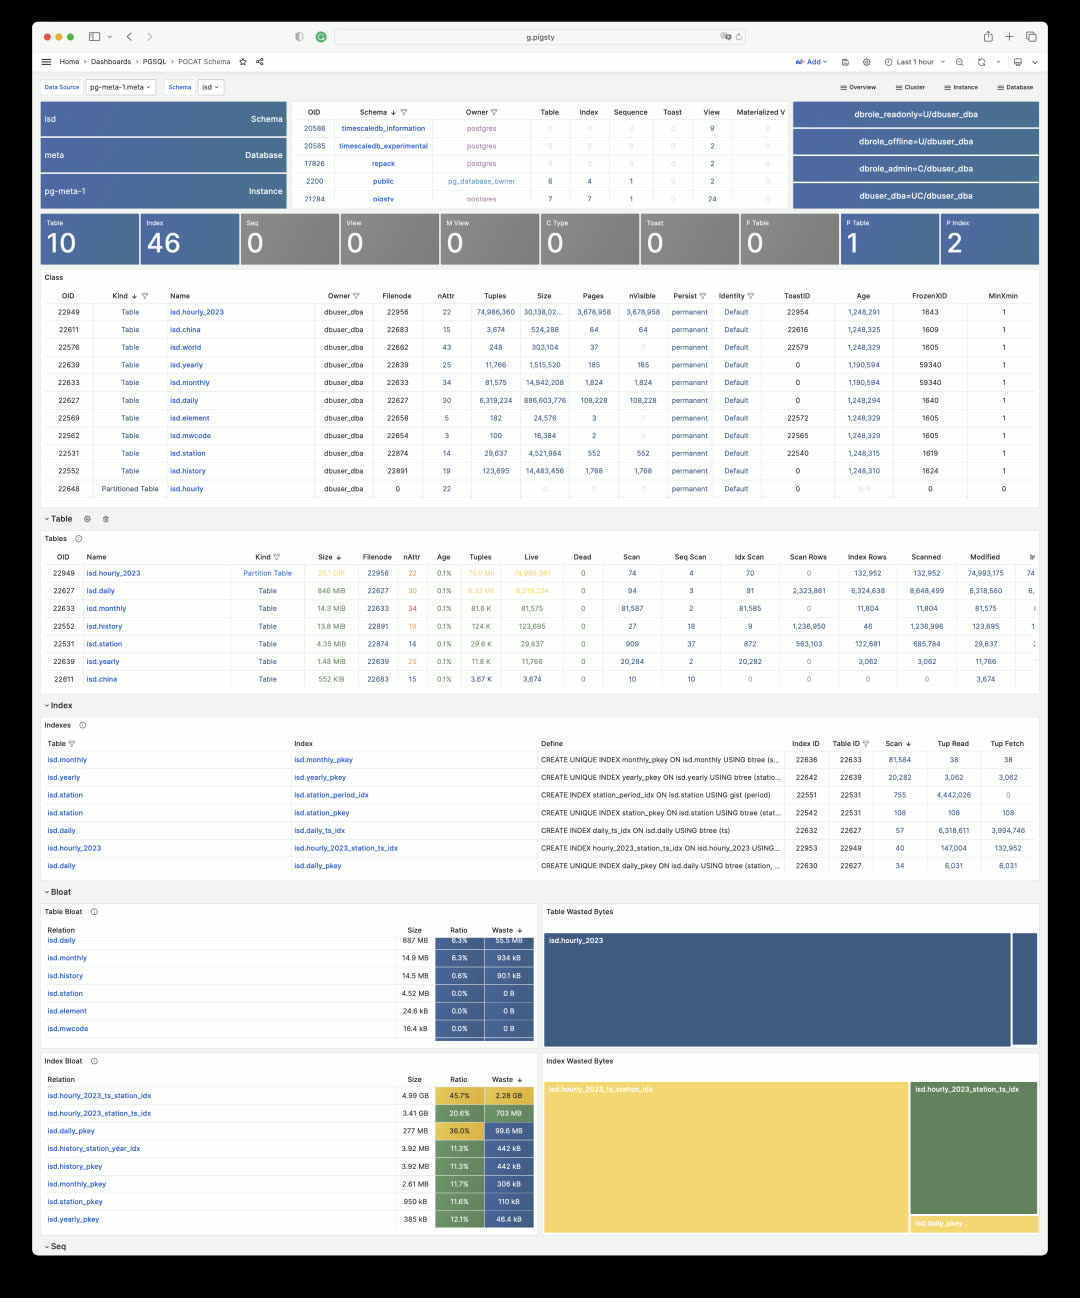
Each schema, table, and index can be clicked to drill down into more detailed dedicated dashboards. For example, PGCAT Schema shows detailed objects within a schema.
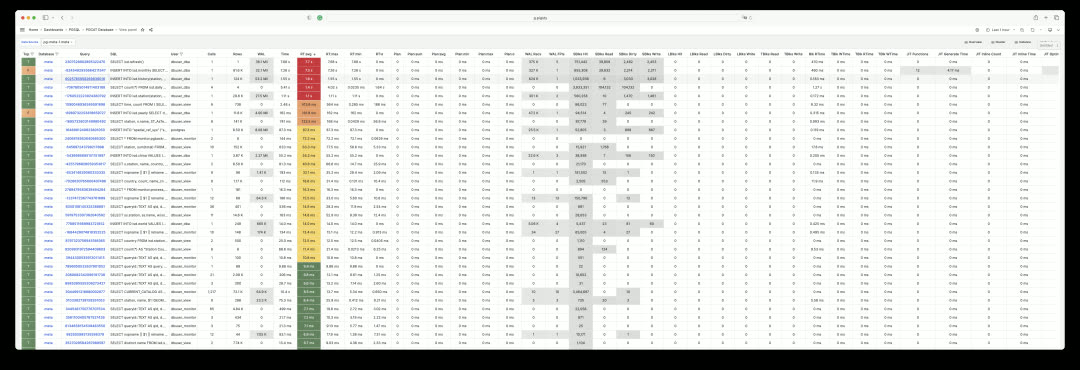
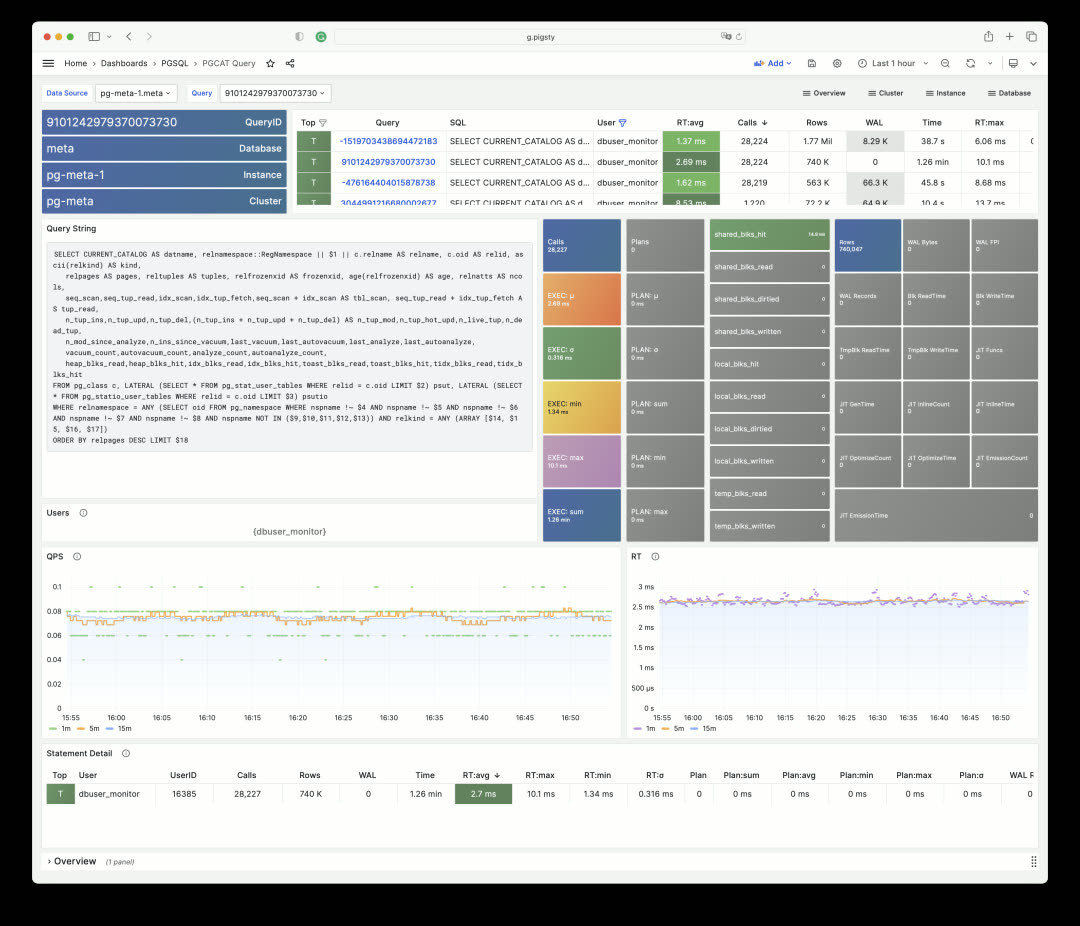
Database queries are also aggregated by execution plan, making it easy to find problematic SQL and quickly locate slow queries.
Monitoring Overhaul: Tables and Queries#
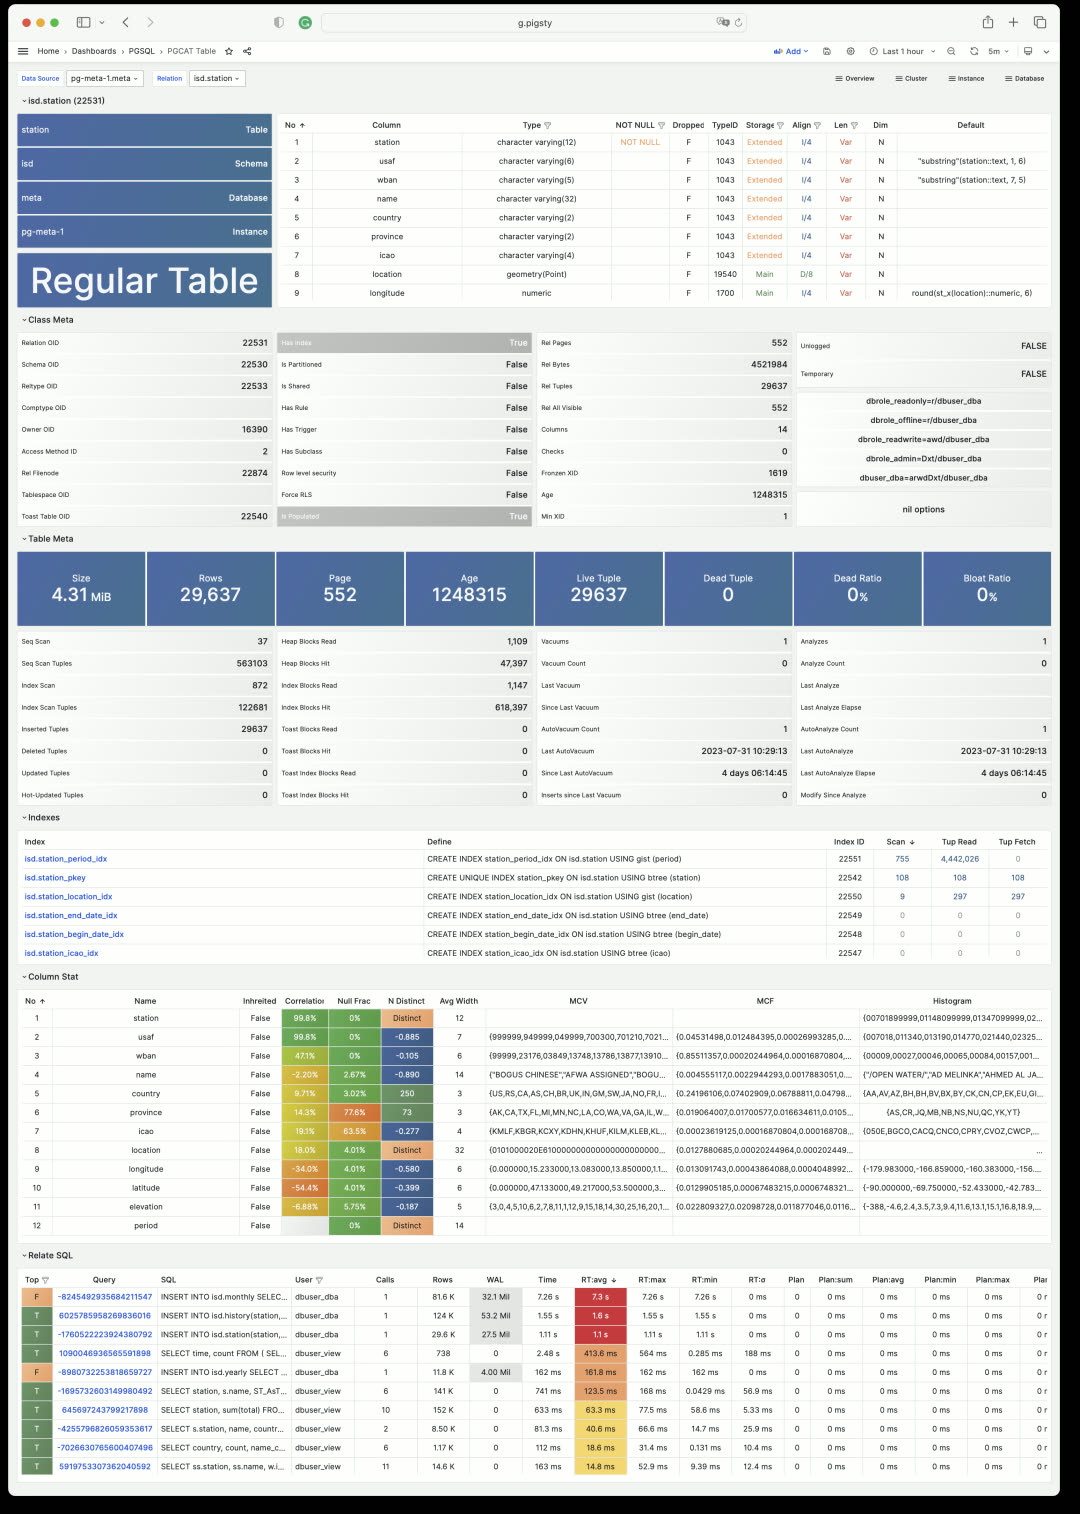
In Pigsty, you can examine every aspect of a table. The PGCAT Table dashboard shows table metadata, its indexes, statistics for each column, and related queries.
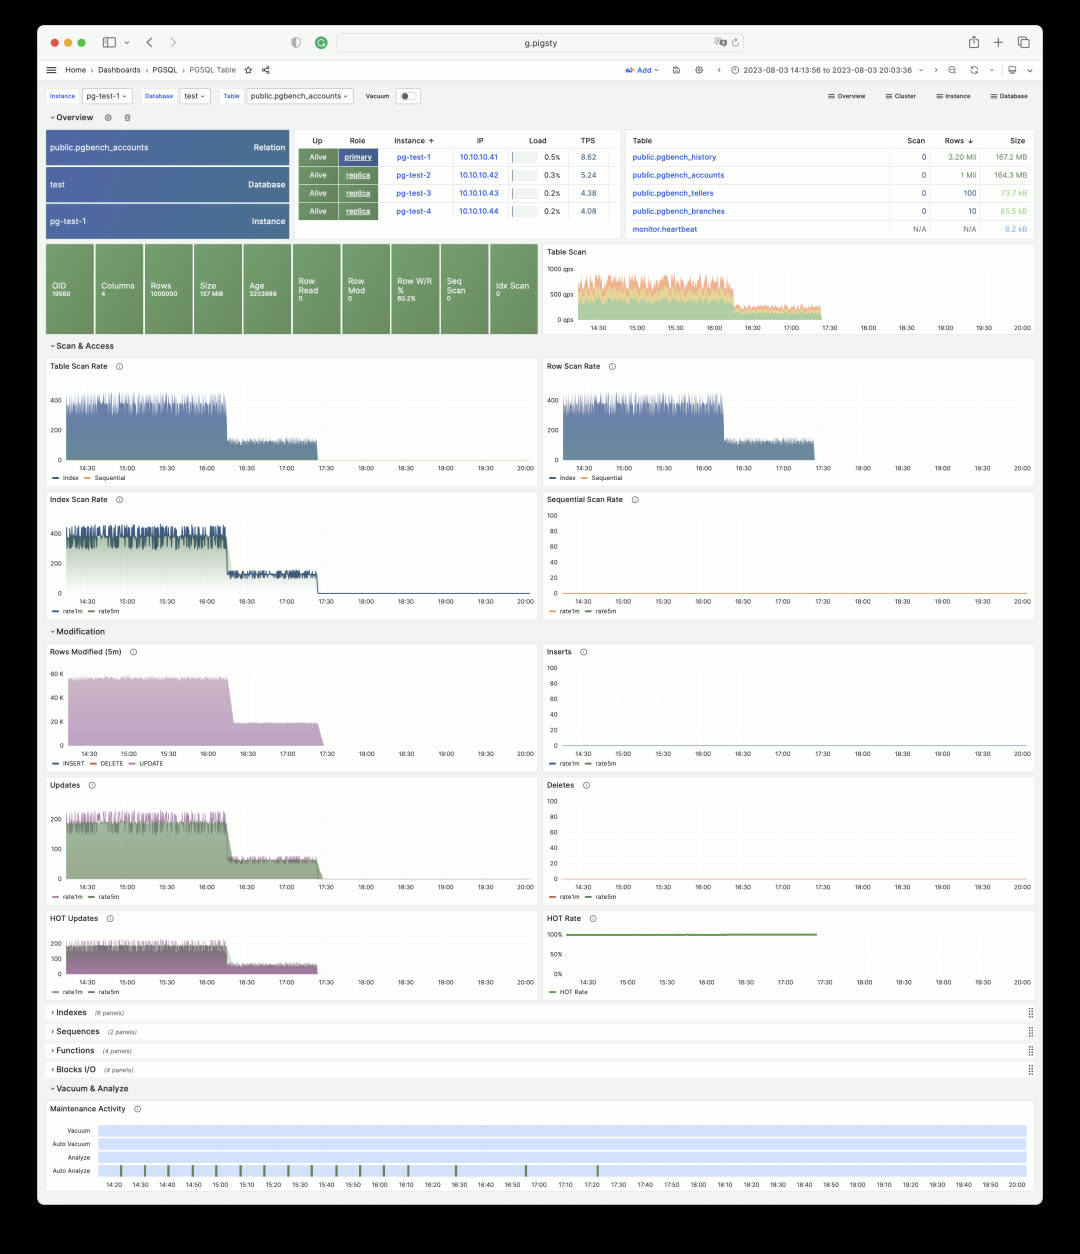
You can also use the PGSQL Table dashboard to view key metrics for a table across any historical time period from a metrics perspective. Click the table name to easily switch between views.
Similarly, you can get detailed information about SQL queries (grouped by identical execution plans).
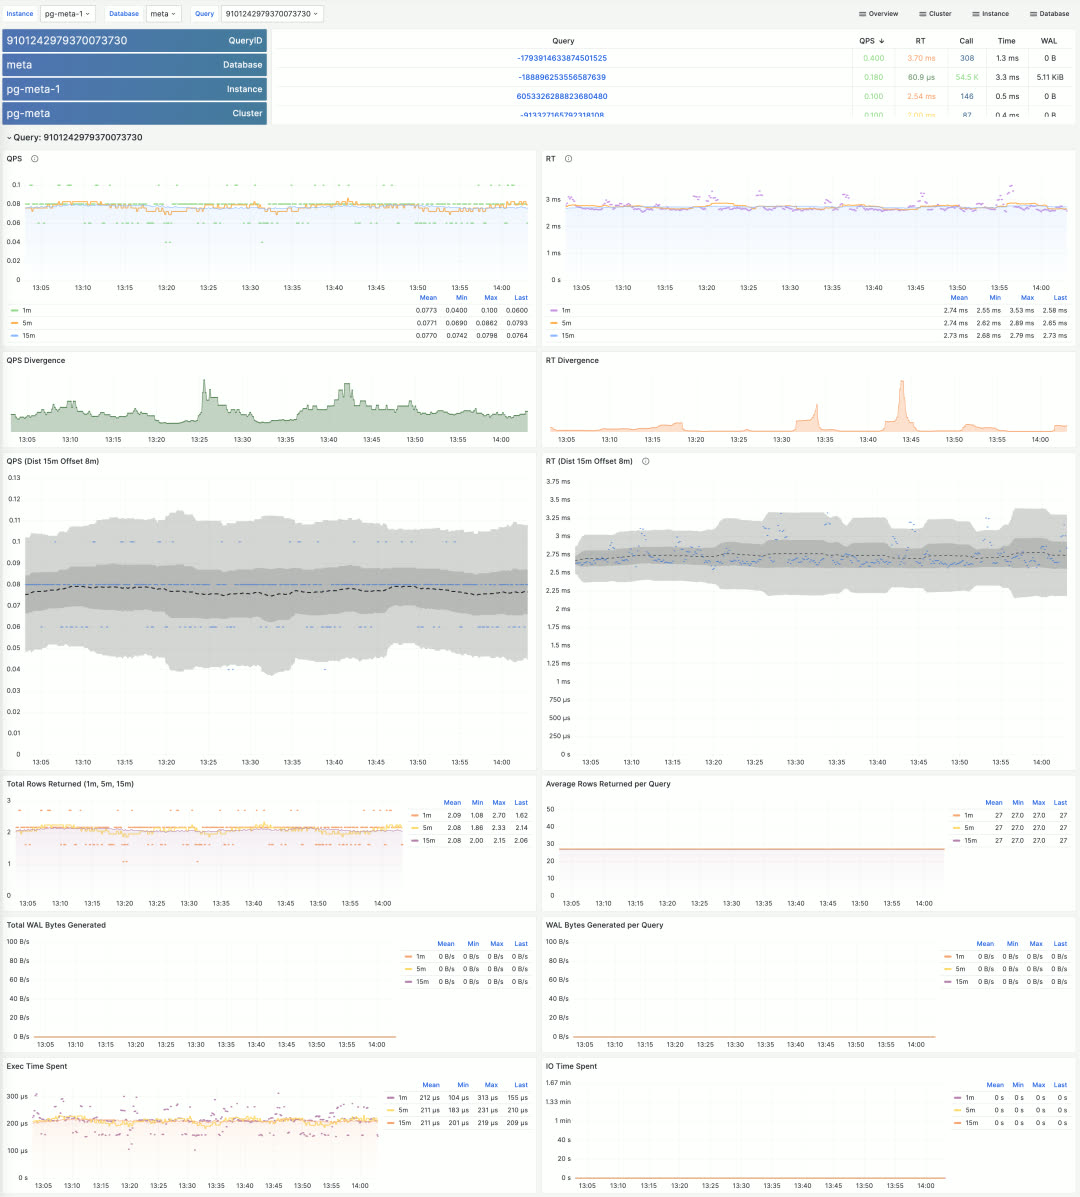
Pigsty includes many more topic-specific dashboards. Due to space constraints, this covers the monitoring system overview. The best way to experience it is to visit the public Pigsty demo: http://demo.pigsty.cc and explore it yourself. While it’s just a modest 4-node environment with 1-core VMs, it’s sufficient to demonstrate Pigsty’s core monitoring capabilities.
Production Simulation Sandbox#
Pigsty provides a Vagrant + VirtualBox sandbox environment that runs on your laptop/Mac. There’s a minimal 1-node version and a full 4-node version for demos and learning. Now v2.2 adds a 42-node production simulation sandbox.
All production sandbox details are described in the prod.yml config file — under 500 lines. It runs easily on a single physical server, and spinning it up is no different from the 4-node version: just make prod install.
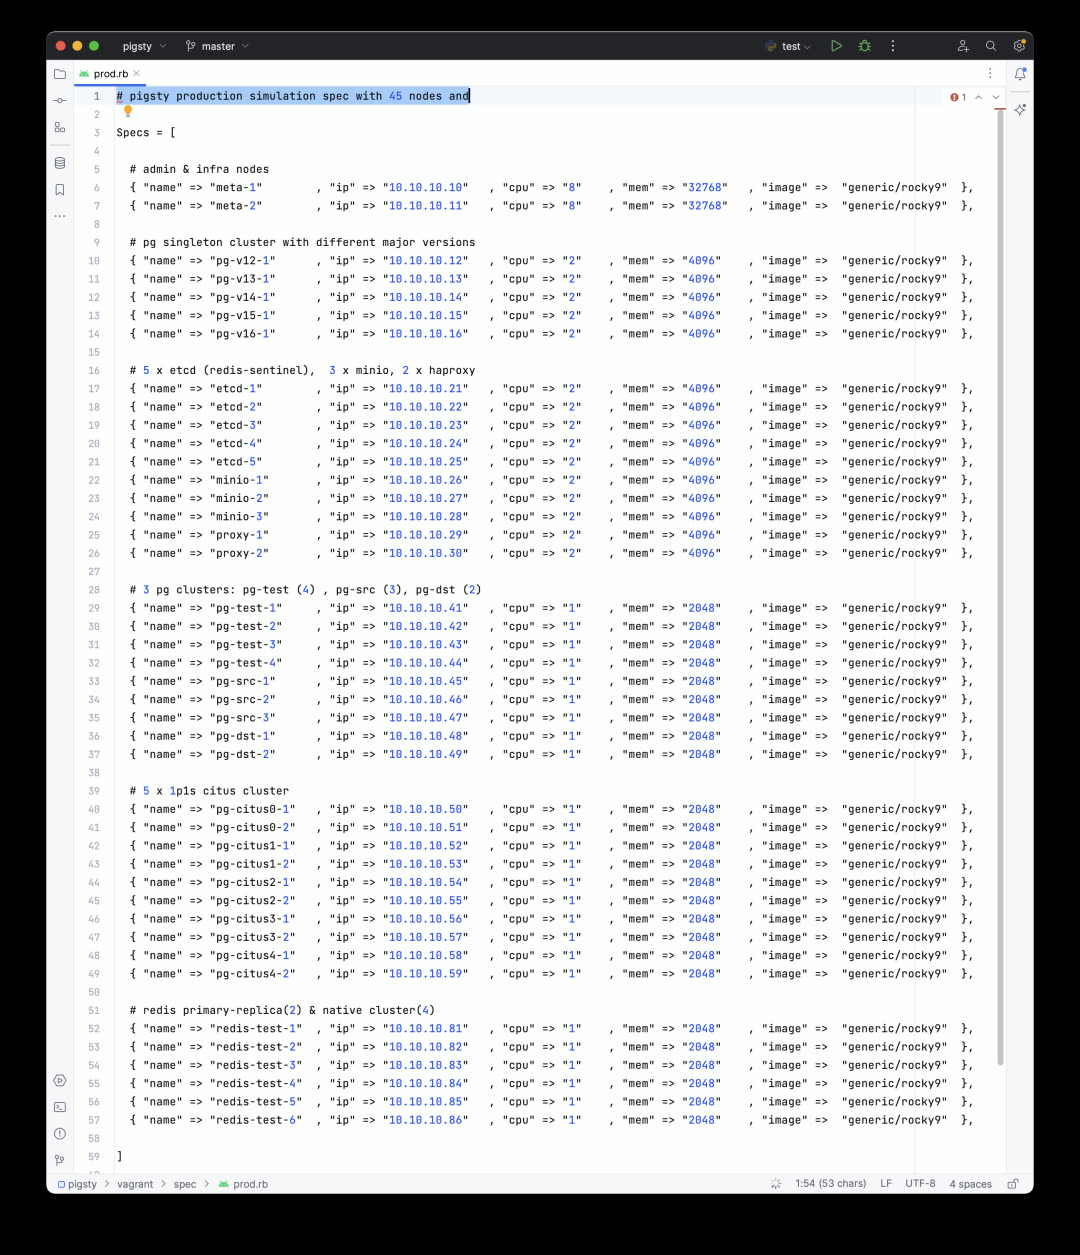
Pigsty v2.2 provides libvirt-based Vagrantfile templates. Simply adjust the machine inventory in the config above, and you can create all required VMs with one command. Everything runs comfortably on a used Dell R730 (48C 256G) — which costs under $400 secondhand. Of course, you can still use Pigsty’s Terraform templates to spin up VMs on cloud providers with one click.
After installation, the environment looks like this: a two-node monitoring infrastructure with primary-standby setup, a dedicated 5-node ETCD cluster, a 3-node MinIO cluster providing object storage for PG backups, and a dedicated 2-node HAProxy cluster for unified database load balancing.
On top of this, there are 3 Redis clusters and 10 PostgreSQL clusters of various configurations, including a ready-to-use 5-shard Citus 12 distributed PostgreSQL cluster.
This configuration serves as a reference for medium-to-large enterprises managing large-scale database clusters — and you can spin it up completely in half an hour on a single physical server.
Smoother Build Process#
When downloading Pigsty software directly from the internet, you might encounter firewall/GFW issues. For example, the default Grafana/Prometheus Yum repos can be extremely slow. Additionally, some scattered RPM packages need to be downloaded via web URLs rather than repotrack.
Pigsty v2.2 solves this problem. Pigsty now provides an official Yum repo: http://get.pigsty.cc, configured as one of the default upstream sources. All scattered RPMs and packages requiring VPN access are hosted there, significantly speeding up online installation/build processes.
Additionally, v2.2 adds support for the domestic Chinese operating system UOS 1050e uel20, meeting special requirements for certain customers. Pigsty has recompiled PG-related RPM packages for these systems.
Installation#
Starting with v2.2, the Pigsty installation command is:
bash -c “$(curl -fsSL http://get.pigsty.cc/latest)"
One command to complete a full Pigsty installation on a fresh machine. To try beta versions, replace latest with beta. For air-gapped environments without internet access, you can download Pigsty and the offline packages containing all software:
http://get.pigsty.cc/v2.2.0/pigsty-v2.2.0.tgz
http://get.pigsty.cc/v2.2.0/pigsty-pkg-v2.2.0.el7.x86_64.tgz
http://get.pigsty.cc/v2.2.0/pigsty-pkg-v2.2.0.el8.x86_64.tgz
http://get.pigsty.cc/v2.2.0/pigsty-pkg-v2.2.0.el9.x86_64.tgz
That’s what Pigsty v2.2 brings to the table.
For more details, check out the official Pigsty documentation: https://pigsty.io and the GitHub Release Notes: https://github.com/pgsty/pigsty/releases/tag/v2.2.0
v2.2.0 Release Notes#
Highlights
- Monitoring Dashboard Overhaul: https://demo.pigsty.cc
- Vagrant Sandbox Redesign: libvirt support with new config templates
- Pigsty EL Yum Repos: Consolidated scattered RPMs, simplified installation/build process
- OS Compatibility: Added UOS-v20-1050e support
- New Config Template: 42-node production simulation configuration
- Unified official PGDG Citus packages (el7)
Software Upgrades
- PostgreSQL 16 beta2
- Citus 12 / PostGIS 3.3.3 / TimescaleDB 2.11.1 / PGVector 0.44
- Patroni 3.0.4 / pgBackRest 2.47 / pgBouncer 1.20
- Grafana 10.0.3 / Loki/Promtail/logcli 2.8.3
- etcd 3.5.9 / HAProxy v2.8.1 / Redis v7.0.12
- MinIO 20230711212934 / mcli 20230711233044
Bug Fixes
- Fixed Docker group permission issue 29434bd
- Made
infraOS user group supplementary rather than primary - Fixed Redis Sentinel systemd service auto-enable state 5c96feb
- Relaxed
bootstrap&configurechecks, especially when/etc/redhat-releasedoesn’t exist - Upgraded to Grafana 10, fixing Grafana 9.x CVE-2023-1410
- Added PG 14-16 command tags and error codes to CMDB
pglogschema
API Changes
New variable:
INFRA.NGINX.nginx_exporter_enabled: Users can now disable nginx_exporter by setting this parameter
Default value changes:
repo_modules:node,pgsql,infra: Redis now provided by pigsty-el repo, no longer needsredismodulerepo_upstream:- Added
pigsty-el: EL version-independent RPMs: grafana, minio, pg_exporter, etc. - Added
pigsty-misc: EL version-specific RPMs: redis, prometheus stack, etc. - Removed
citus: PGDG now has complete EL7-EL9 Citus 12 support - Removed
remi: Redis now provided by pigsty-el repo
- Added
repo_packages: Consolidated package lists (see source for details)repo_url_packages:node_default_packages: Updated package listinfra_packages: Updated package listPGSERVICEin.pigstyreplaced withPGDATABASE=postgres, allowing users to access specific instances from admin node using just IP address
Directory structure changes:
bin/dnsandbin/sshmoved tovagrant/directory
MD5 (pigsty-pkg-v2.2.0.el7.x86_64.tgz) = 5fb6a449a234e36c0d895a35c76add3c
MD5 (pigsty-pkg-v2.2.0.el8.x86_64.tgz) = c7211730998d3b32671234e91f529fd0
MD5 (pigsty-pkg-v2.2.0.el9.x86_64.tgz) = 385432fe86ee0f8cbccbbc9454472fdd