


Pigsty v1.4 is officially released! A brand new modular architecture: four built-in modules INFRA, NODES, PGSQL, REDIS can be used independently and freely combined; new MatrixDB time-series data warehouse deployment and monitoring support; global CDN acceleration for downloads.
GitHub stars are taking off!

Modular Architecture#
The core feature of Pigsty v1.4 is a major refactor of the underlying architecture. In v1.4, the entire system decouples into 4 independent modules that can be maintained separately and freely combined:
| Module | Purpose |
|---|---|
| INFRA | Infrastructure: monitoring/alerting/visualization/logging/DNS/NTP and other shared components |
| NODES | Host node management module |
| PGSQL | PostgreSQL database deployment and management module |
| REDIS | Redis database deployment and management module |
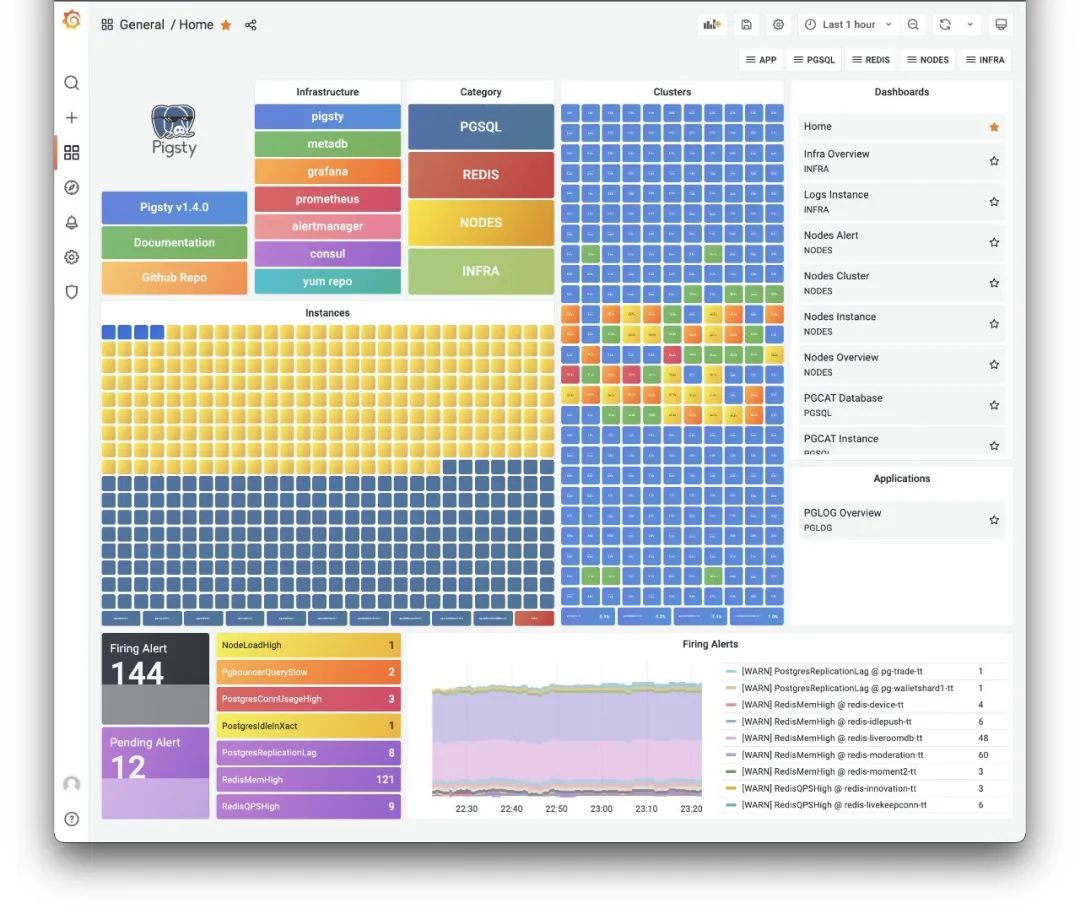
The new Pigsty v1.4 monitoring home dashboard
Typical deployment scenarios:
Single-node PostgreSQL distribution: Install INFRA + NODES + PGSQL modules sequentially on one machine to get a ready-to-use, self-monitoring database instance.
Production-grade host monitoring system: Install the INFRA module on one machine, install the NODES module on all monitored nodes. All host nodes get configured with software repos, packages, DNS, NTP, node monitoring, log collection, DCS Agent — everything needed for production.
Massive PostgreSQL clusters: Add the PGSQL module on nodes managed by Pigsty. One-click deploy various PostgreSQL clusters: single instance, primary with N replicas HA cluster, synchronous cluster, quorum-commit sync cluster, clusters with offline ETL roles, standby clusters for disaster recovery, delayed replication clusters, Citus distributed clusters, TimescaleDB clusters, MatrixDB data warehouse clusters.
Redis clusters: Add the REDIS module on Pigsty-managed nodes. Future database modules (like KAFKA, MINIO, MYSQL) can be added to Pigsty in similar fashion.
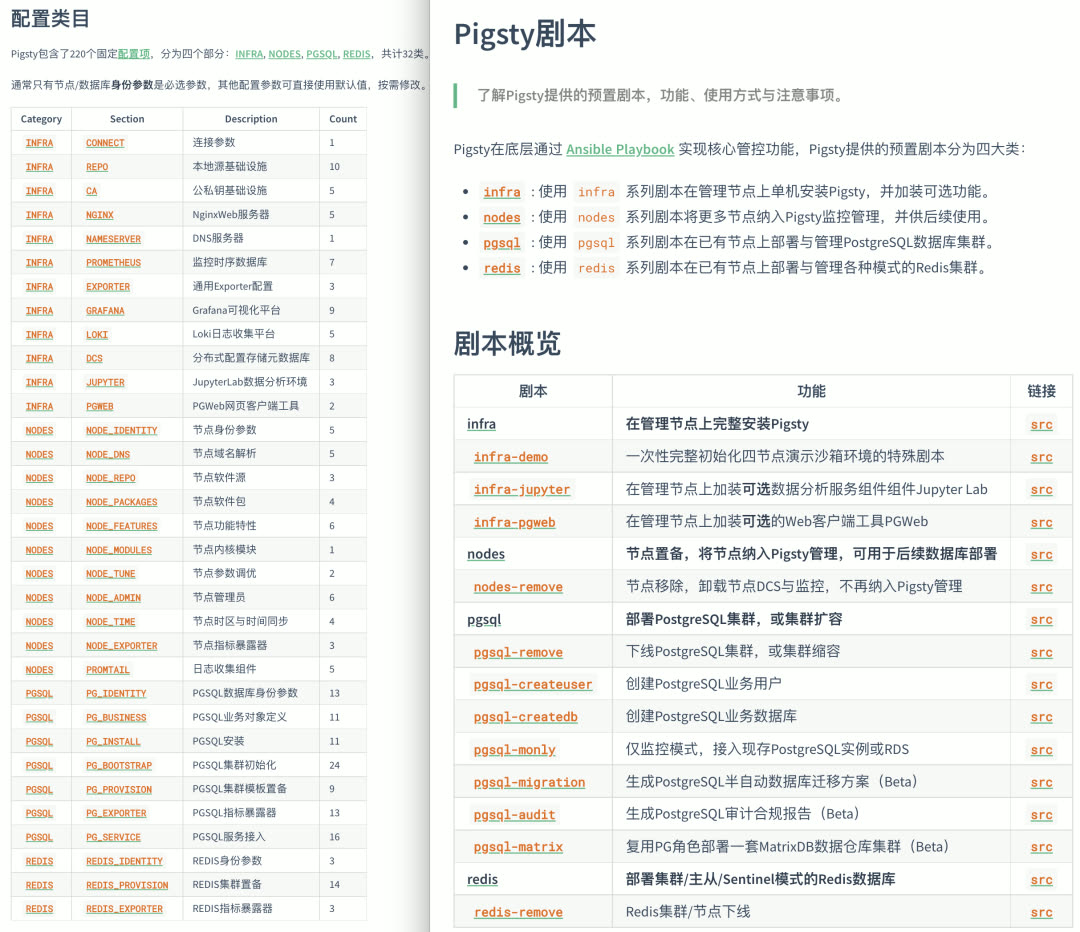
Modular playbooks and configuration parameters
New Database Support#
PostgreSQL is a versatile database kernel, but as organizations and data grow, specialized data components become necessary. The two most typical are: caching (Redis) and data warehousing (Greenplum).
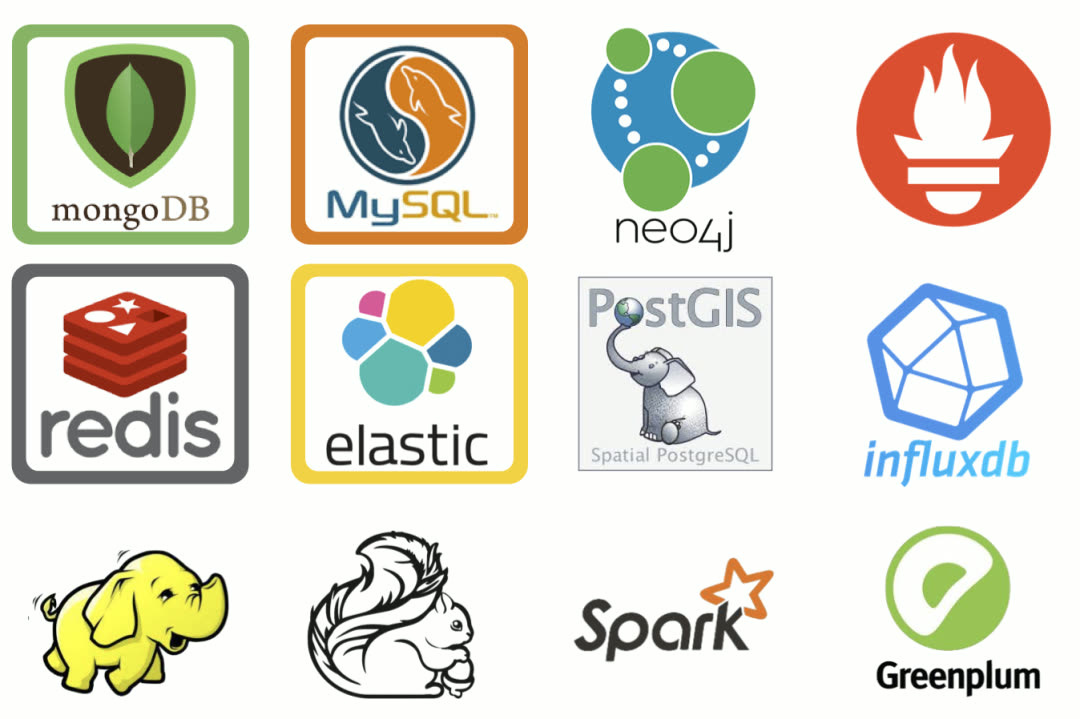
Redis further strengthens business system OLTP capabilities, offloads database pressure, and developers love its simple model. Greenplum significantly enhances OLAP capabilities, using the same language, drivers, and interfaces as PostgreSQL, scaling analytics from tens of TB to PB or even ZB scale.
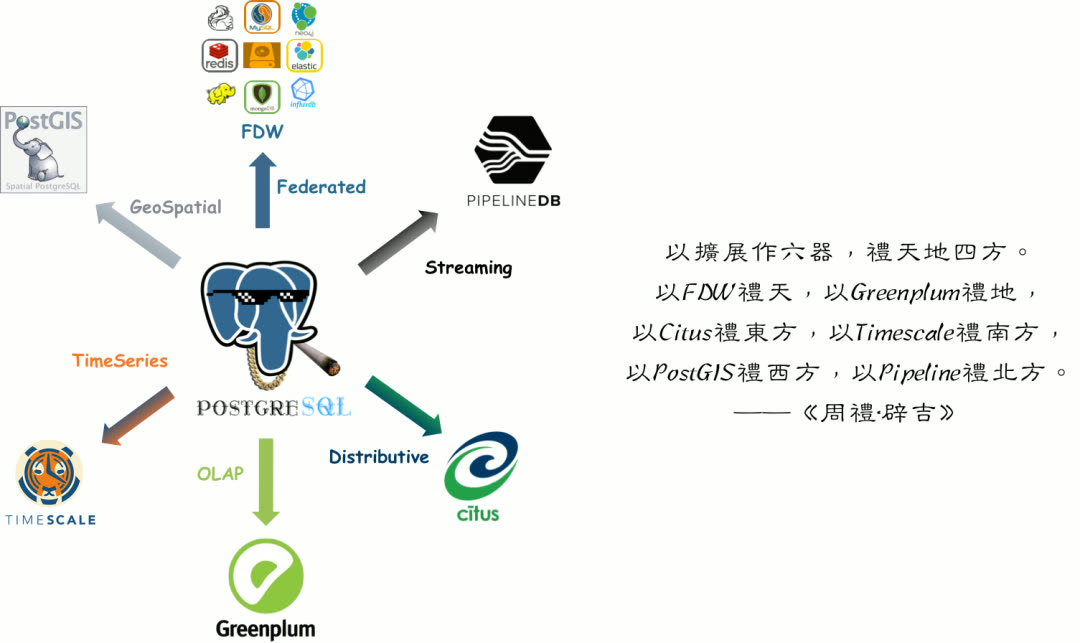
Redis and Greenplum extend PostgreSQL’s capability boundaries in two directions — both are common PostgreSQL companions, frequently used together. Therefore, Pigsty v1.4 provides preliminary support for Redis and Greenplum.
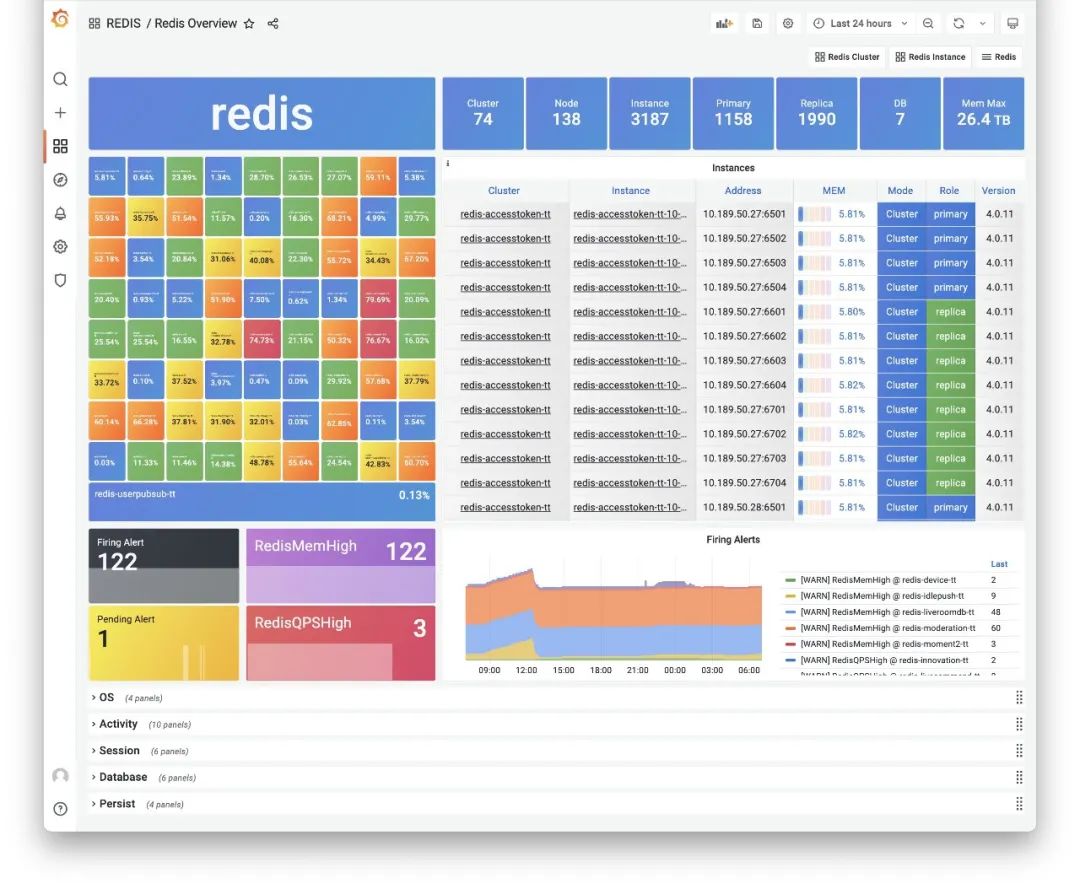
Redis Overview Dashboard
Note that Pigsty supports not native Greenplum, but a fork: MatrixDB. The official Greenplum version is still 6.x based on PostgreSQL 9.6 kernel. MatrixDB is based on Greenplum 7 and PostgreSQL 12 kernel, with additional time-series functionality. So Pigsty uses MatrixDB as the Greenplum implementation.
In Pigsty v1.4, there’s no dedicated MATRIXDB module — MatrixDB deployment completely reuses the PGSQL module. You can configure MatrixDB with familiar configuration parameters. From Pigsty’s perspective, a MatrixDB data warehouse is logically N pairs of standard primary-replica PGSQL clusters: one standard Master cluster (Master & Standby), and multiple Segment clusters (Primary & Mirror) distributed across nodes. All PGSQL dashboards work directly with MatrixDB.
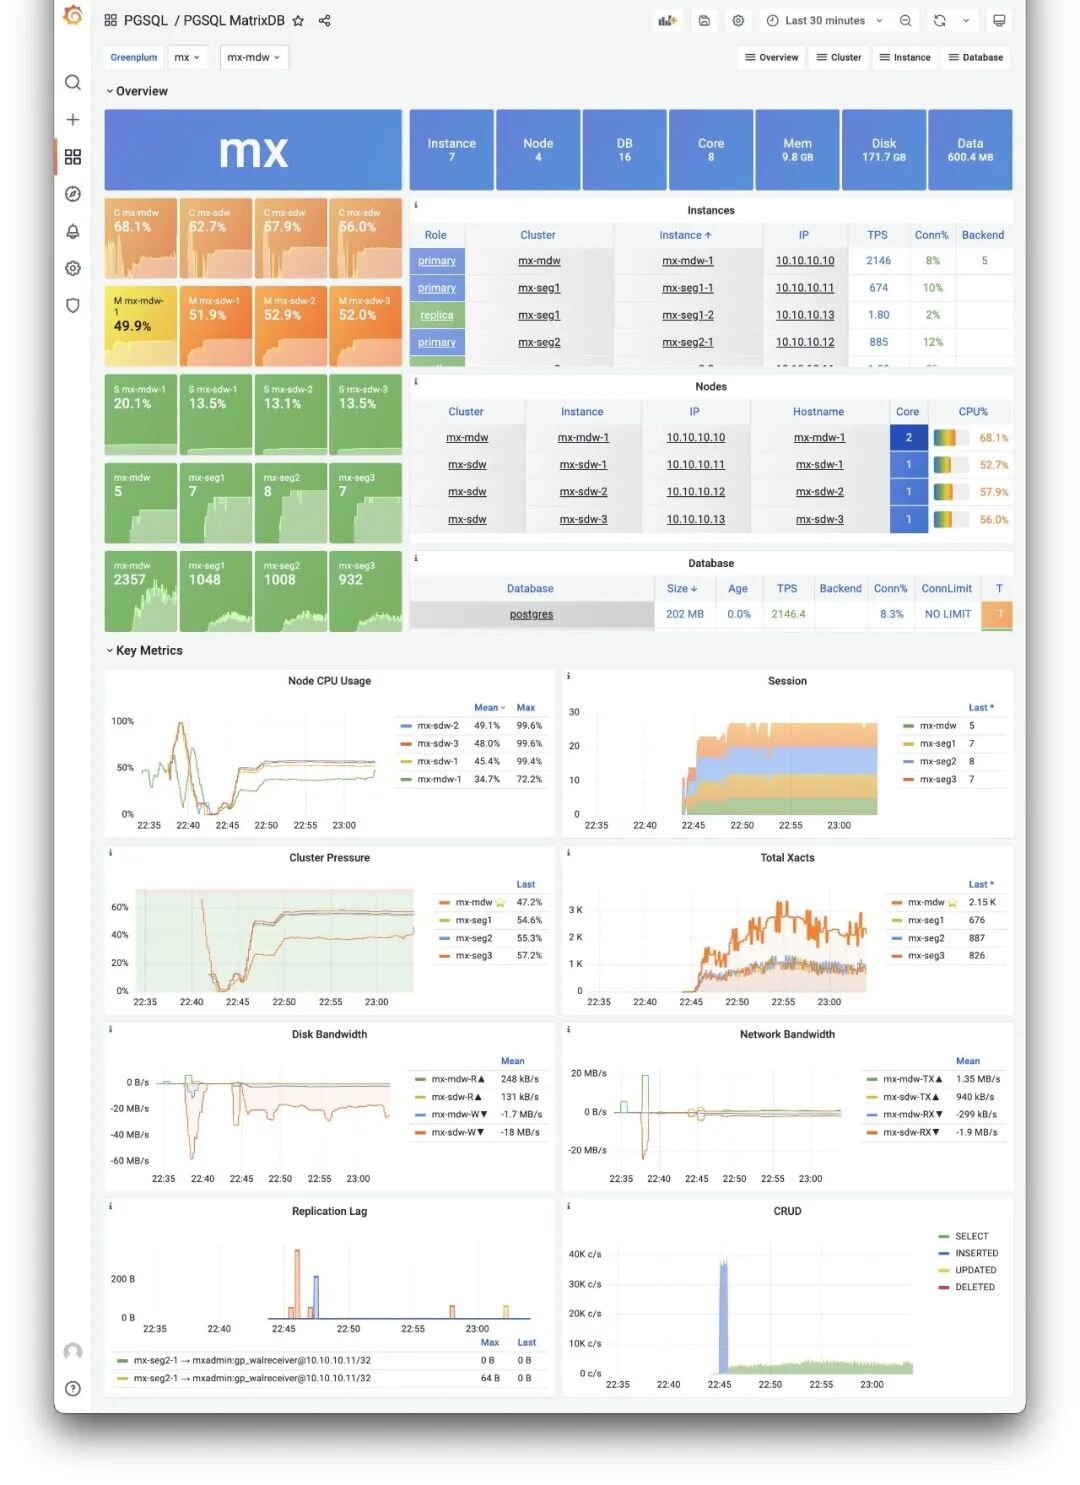
PGSQL MatrixDB Dashboard
The dedicated PGSQL Matrix dashboard shows core monitoring metrics for a MatrixDB deployment, while other monitoring dashboards reuse existing PGSQL panels.
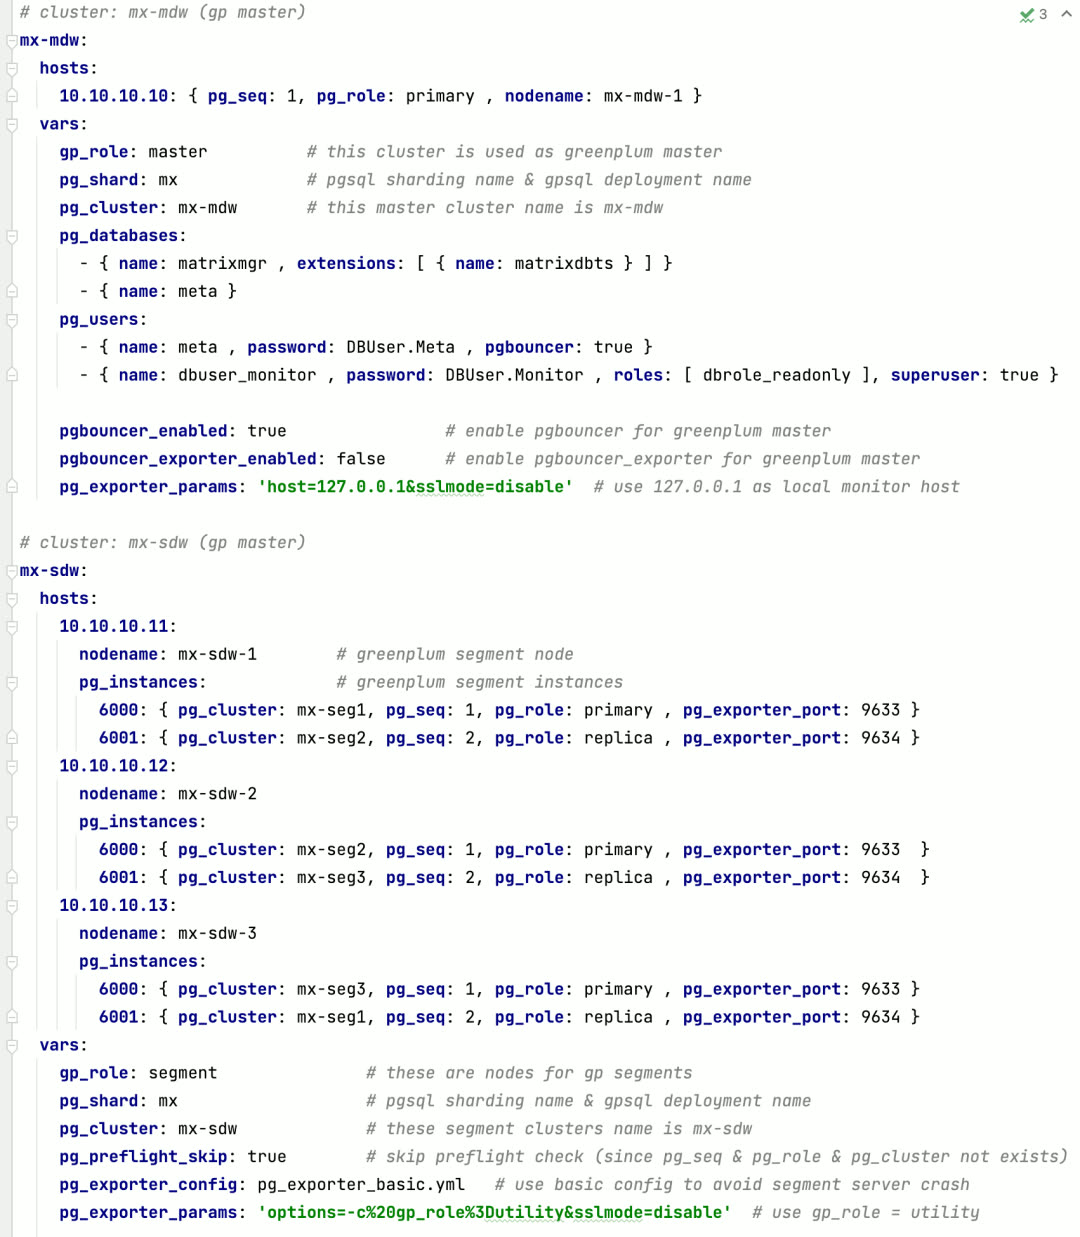
Defining a 4-node MatrixDB requires only this configuration
Monitoring System Evolution#
The monitoring system has always played a core role in Pigsty. In v1.4, Pigsty’s monitoring system has significant improvements.
Host Monitoring#
Pigsty v1.4 introduces brand new node monitoring capabilities — a direct result of the modular refactor. Previously, machine monitoring metrics were 1:1 bound to PostgreSQL instances. For a PostgreSQL distribution, this design was fine. But as Pigsty evolved, this design became outdated.
NODES Overview panel, providing navigation for all nodes
Users may have various deployment strategies, such as deploying multiple database instances on one node, or even multiple different database types. In such cases, the right approach is to separate node management and monitoring from specific database types.
This brings two significant benefits: first, if users only need node monitoring and management without database monitoring, it’s much simpler than before; second, a single node can deploy multiple or even different types of databases while reusing the same node monitoring data. Anytime you click an IP address, you jump to the specific NODES Instance to view node details.
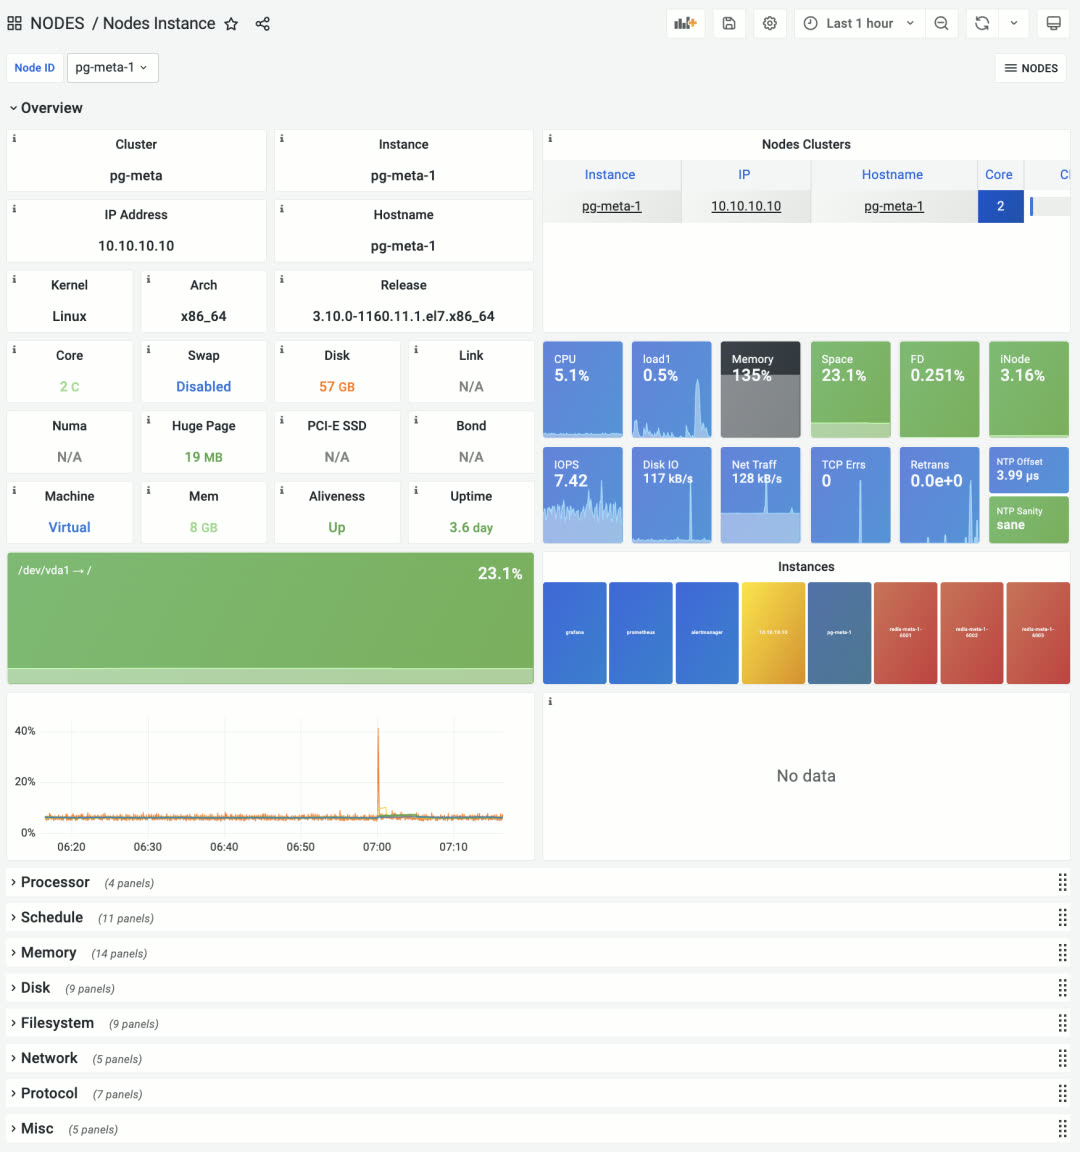
The former PGSQL Node is now NODES Instance
Node monitoring provides three levels: global overview, cluster, and single node. Node clusters can be configured to match PostgreSQL database clusters by default, or have independent identity configuration for viewing cluster resources from different perspectives.
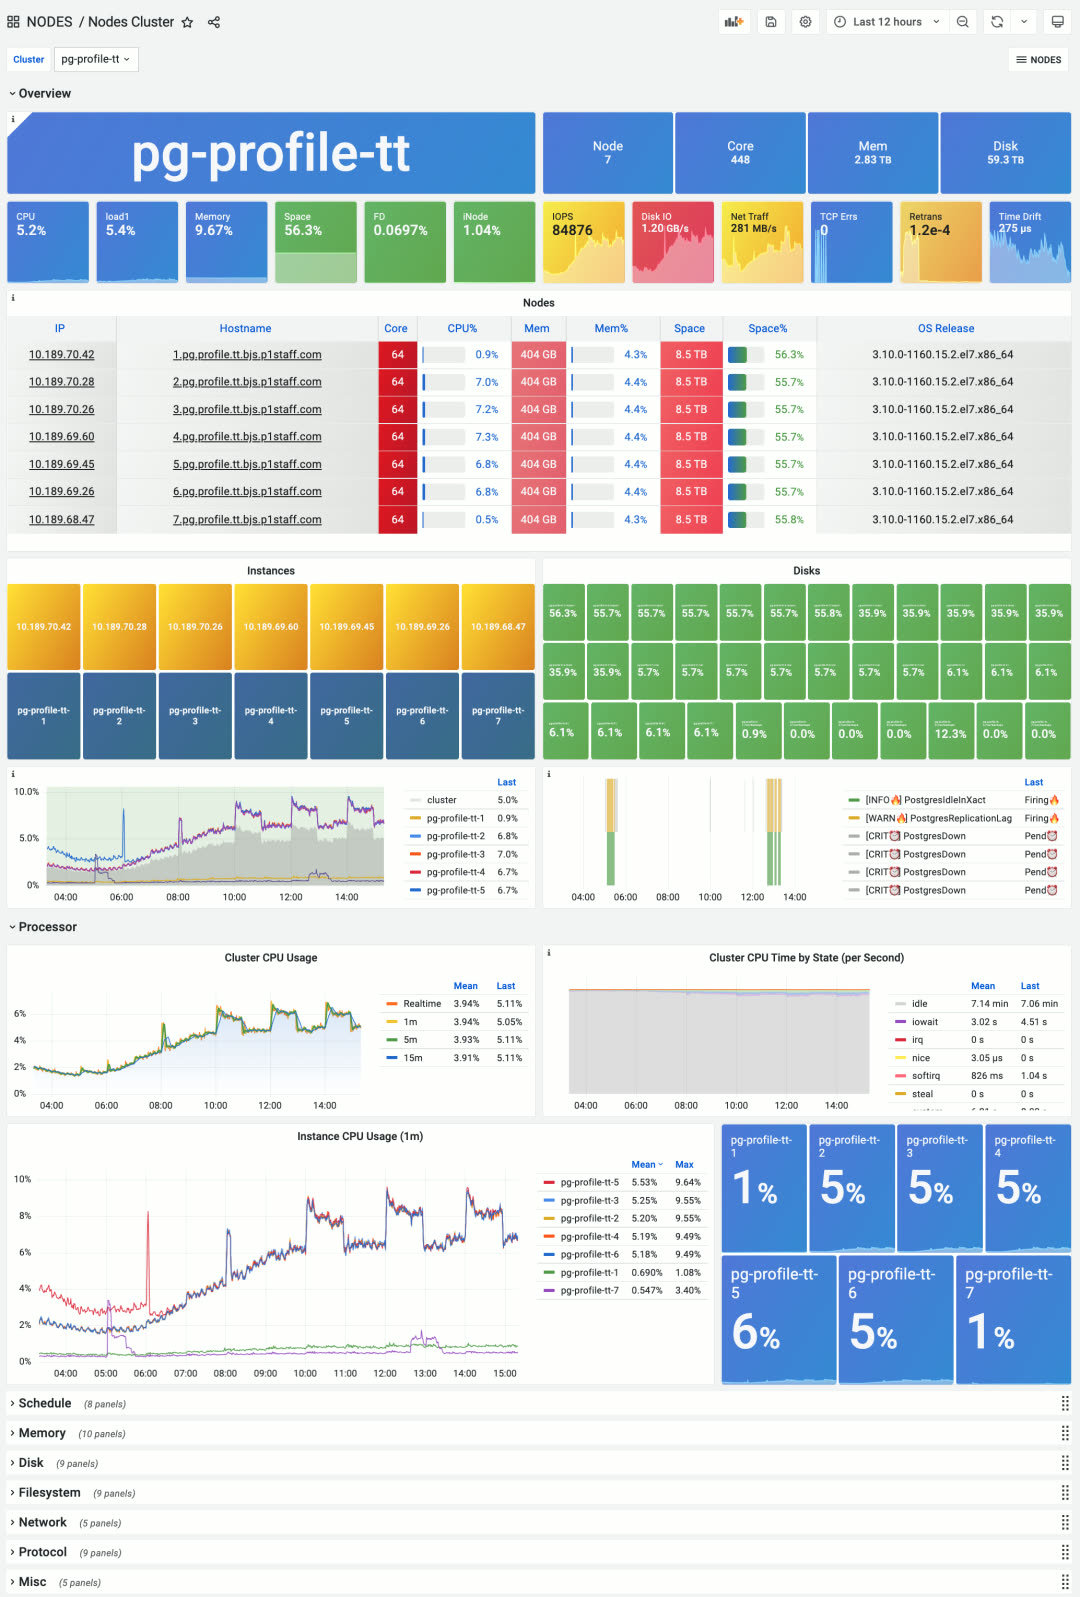
New Nodes Cluster panel, focusing on aggregate metrics and horizontal comparison within a node group
While Pigsty is positioned as a batteries-included PostgreSQL distribution, it also contains host monitoring best practices. Some users don’t need database features at all — they just use Pigsty for host monitoring.
Log Collection#
In Pigsty v1.4, Loki and Promtail log collection components are upgraded to default system components. Loki, made by Grafana Labs, uses a label system similar to Prometheus with LogQL similar to PromQL. It’s a lightweight, elegant log collection, processing, and analysis solution.
After a year of testing and refinement, Loki is now a default part of Pigsty, collecting various logs in real-time: node syslog, dmesg, cron logs, database postgres/pgbouncer/patroni logs, and Redis logs.
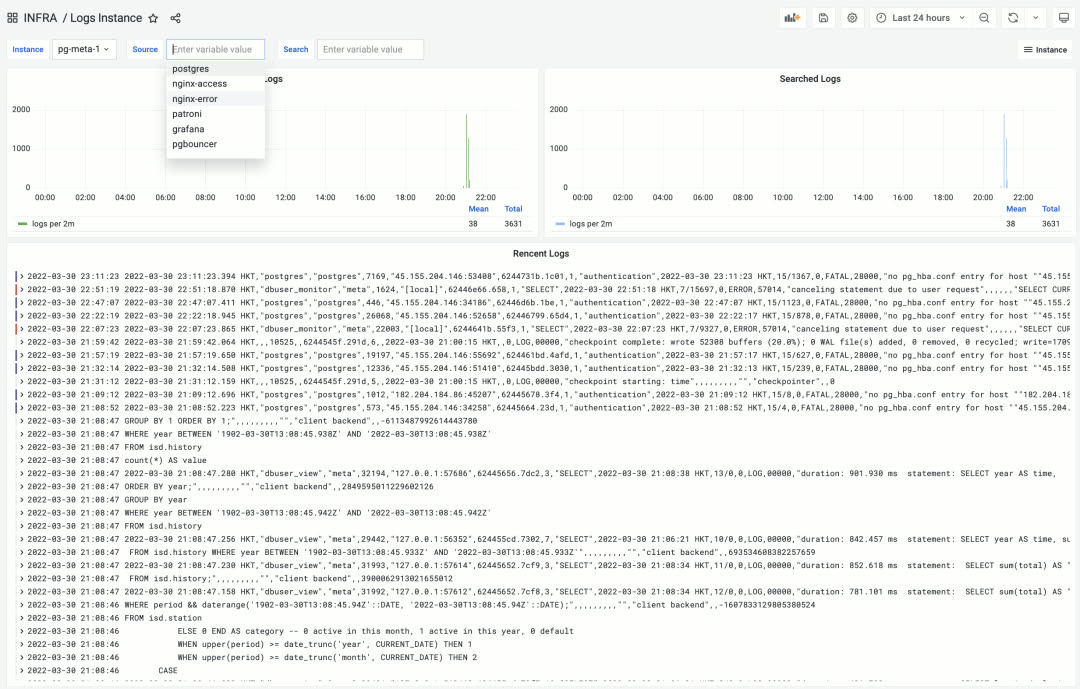
LOGS Instance monitoring panel in the INFRA section for real-time log browsing and searching
ELK is overkill for SRE logging needs — what people really want is an efficient, fast, massively parallel GREP. Loki excels at this.
Additionally, besides node logs, you can also view real-time infrastructure log data from the new INFRA Overview panel.
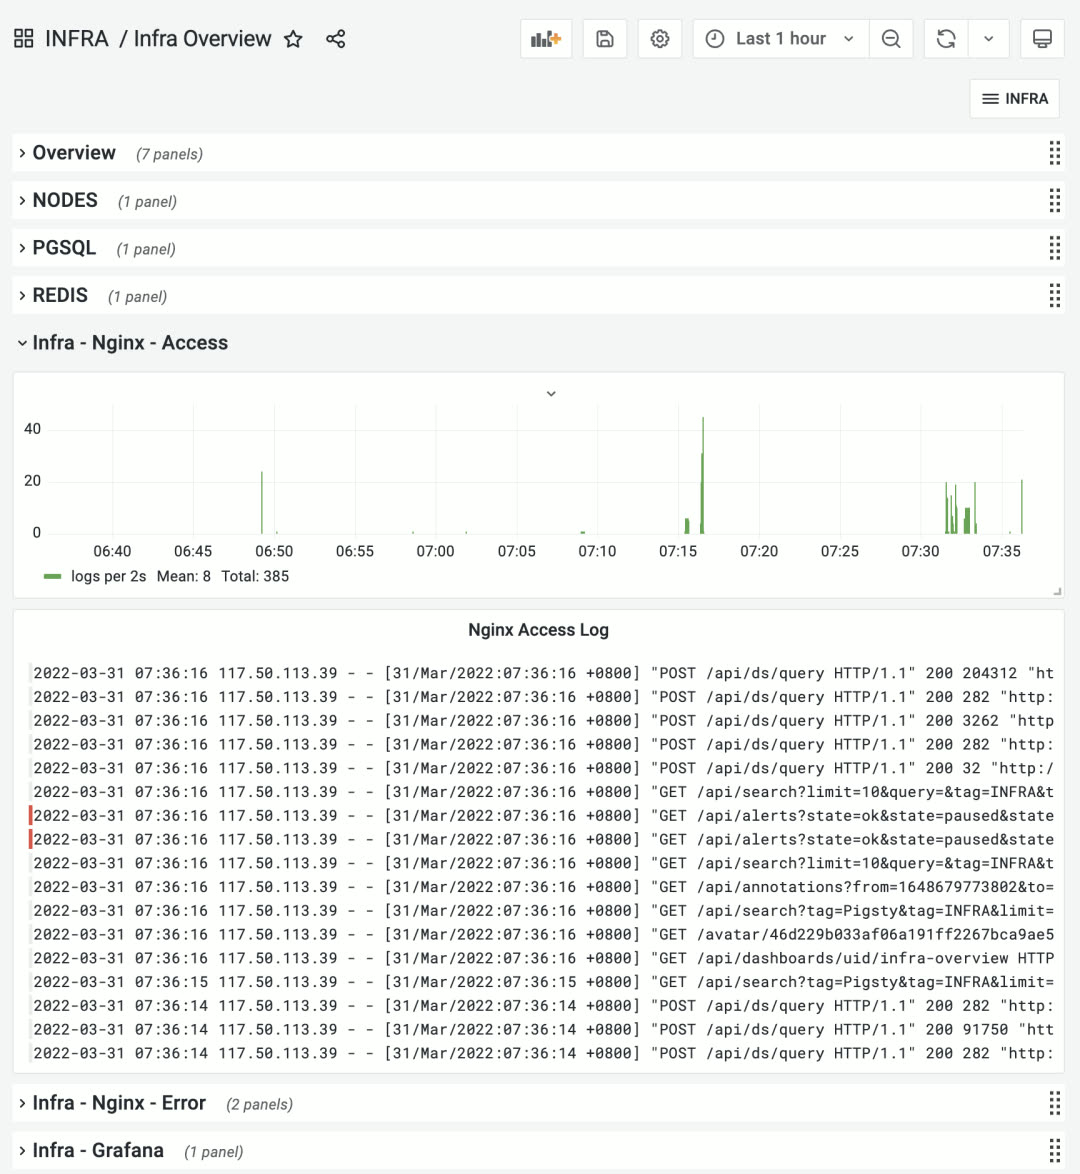
INFRA Overview panel showing infrastructure logs
PGSQL Monitoring#
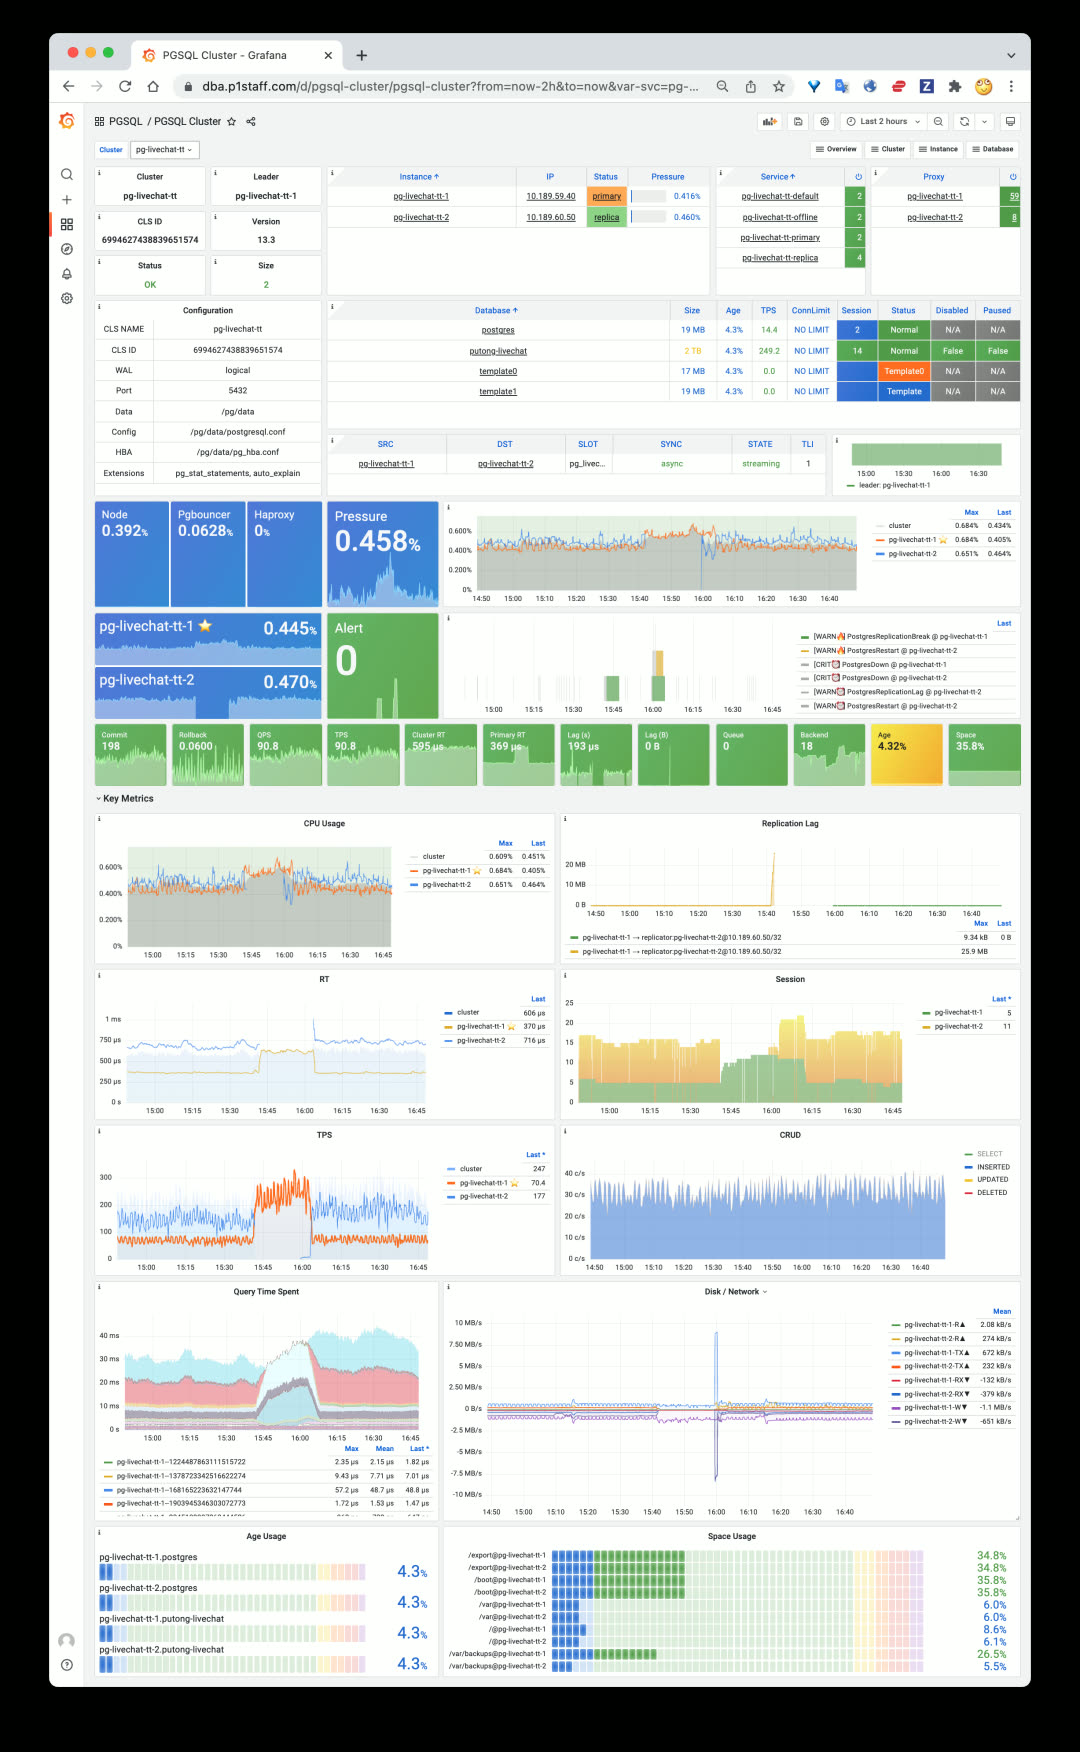
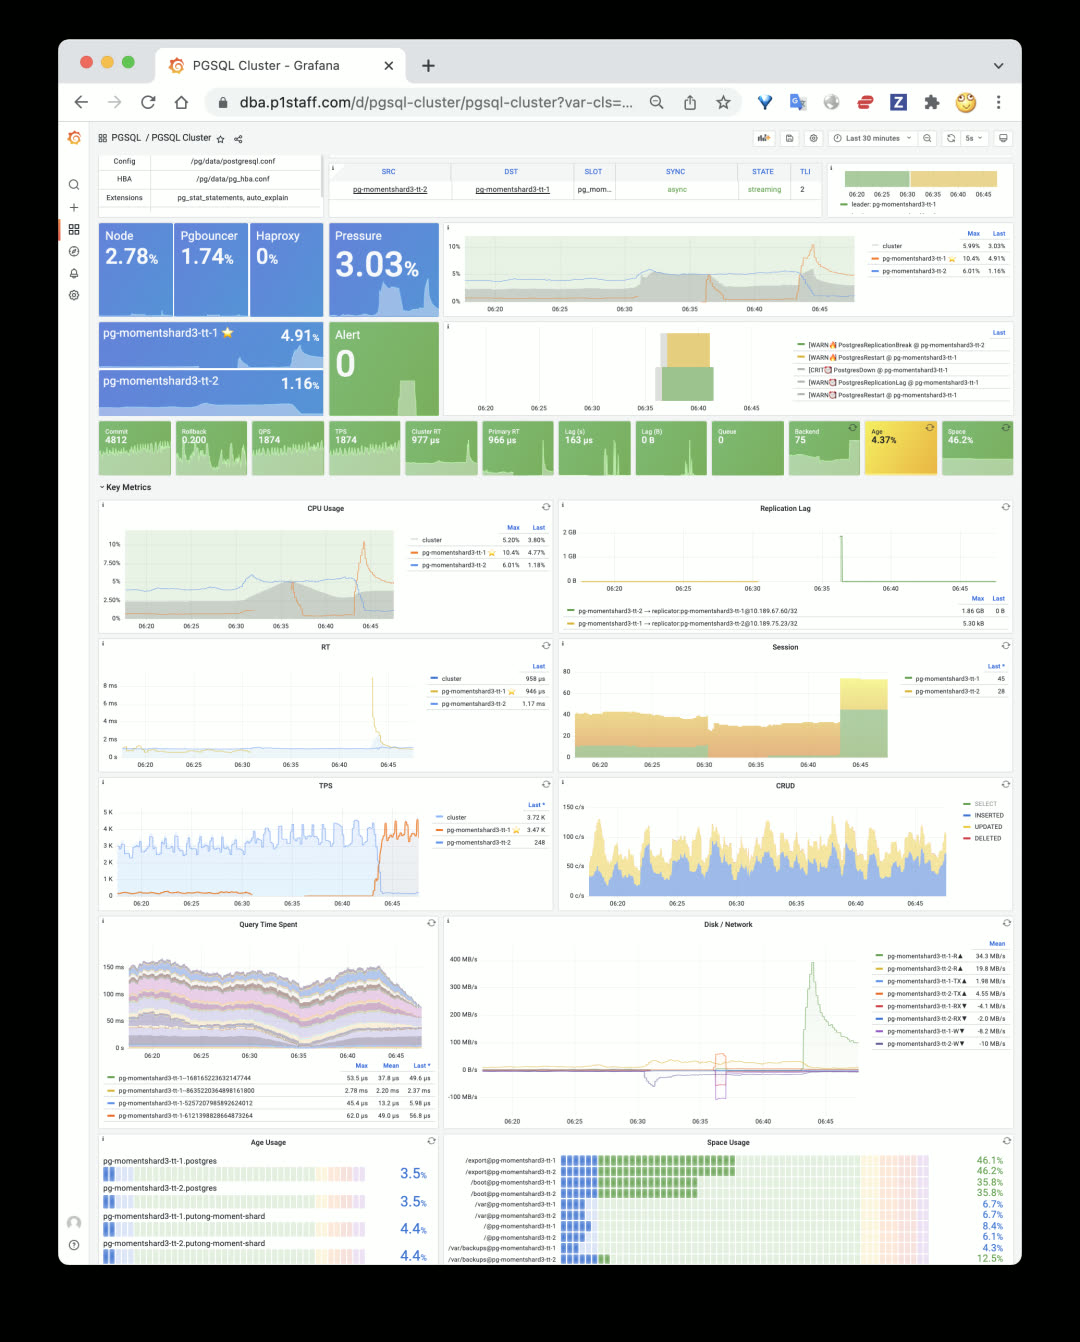
Pigsty v1.4 provides monitoring support for new database types, but classic PostgreSQL monitoring wasn’t neglected. In v1.4, many PGSQL monitoring panels were adjusted and remade. The most representative is the PGSQL Cluster panel.
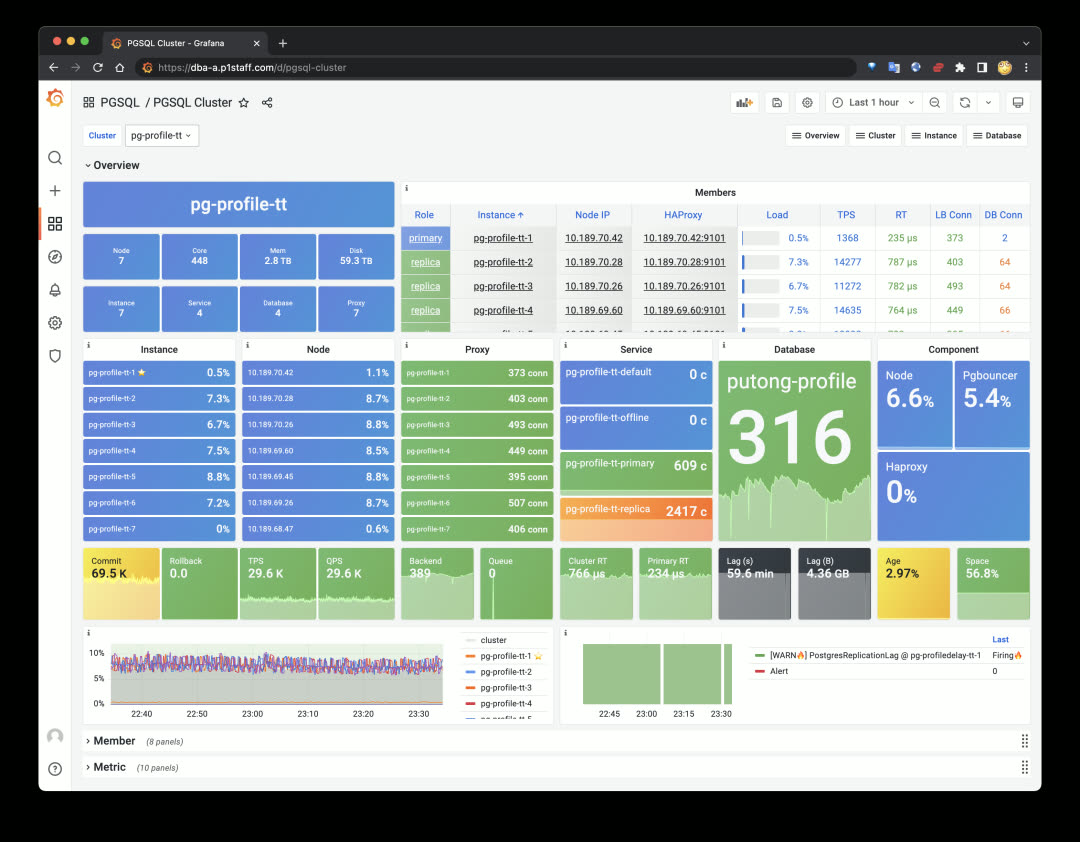
New PGSQL Cluster monitoring panel first screen
PGSQL Cluster is one of the most core monitoring panels in Pigsty database monitoring, serving as a connecting hub to display an autonomous database cluster’s key status. The new design hides unnecessary information and focuses on cluster resources. You can quickly click cluster resource objects from the first screen to navigate to detailed monitoring panels: including nodes, instances, load balancers, services, databases, and service components.
Beyond cluster resource objects, PGSQL Cluster’s first screen only shows the most critical monitoring metrics, alert events, and cluster/instance pressure levels. Other details are hidden in the topic sections below.
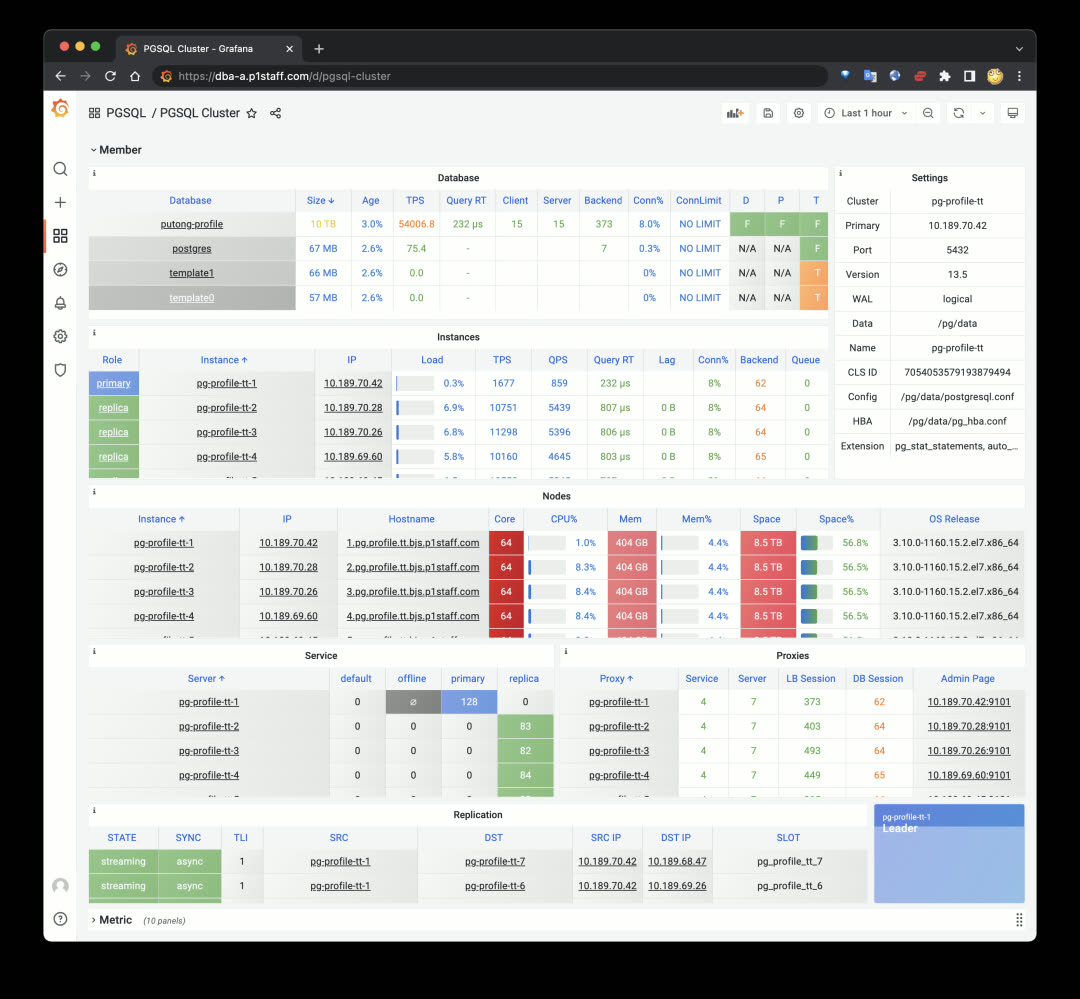
Member details table in the hidden second section by default
The second significant improvement is the new PGSQL Databases panel. Previously, database-internal monitoring only focused on single objects within single instances. But for business objects like tables and indexes, the focus is on their overall metrics across the entire cluster. PGSQL Databases was created for this. You can query a database’s performance across the entire cluster, horizontally comparing differences between instances:
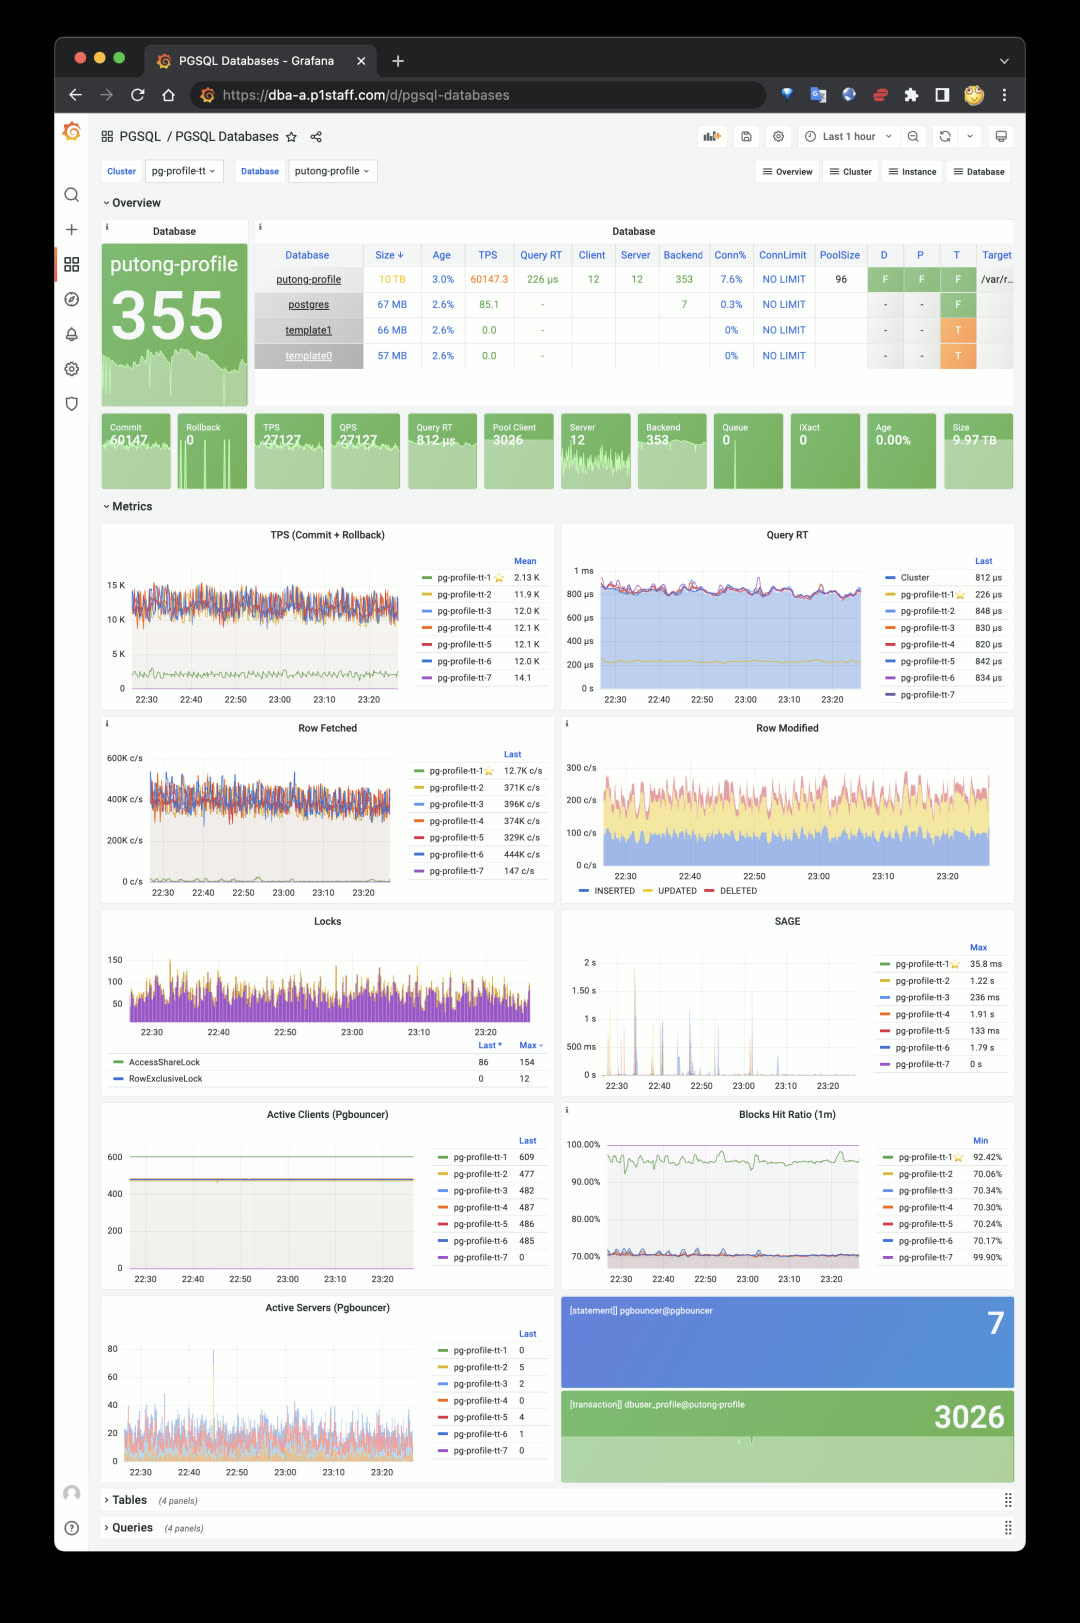
PGSQL Databases panel:
agg(metrics{datname=*}) by (ins)
More importantly, you can see aggregate views of every table and query type across the cluster scope. For example, check a table’s or query type’s QPS on the cluster’s primary and replica instances, or confirm an index’s usage across different cluster instances — enabling targeted business and application optimization.
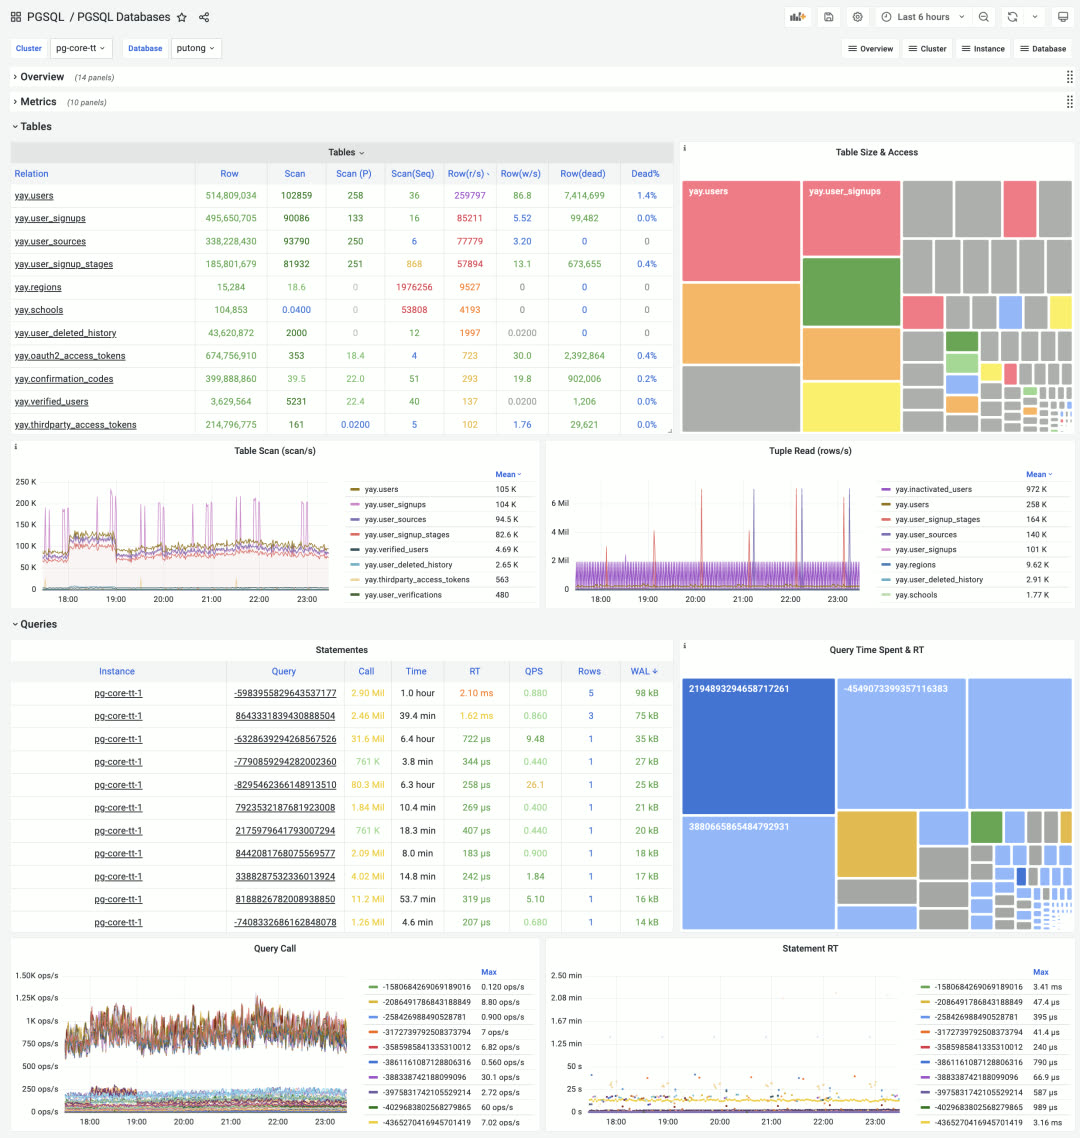
Cluster-level aggregate display of database objects: Tables & Queries, click to drill down
The colored TreeMap quickly reflects two-dimensional attributes: for tables, size represents space occupied, color represents access frequency. For queries, size represents total time spent on that query type, color represents average response time.
Application Dashboards#
Besides the four core modules INFRA, NODES, PGSQL, REDIS, the Pigsty Grafana home has one more section: APP. This is for user applications. Any monitoring dashboard tagged with APP and Overview appears in Pigsty’s dashboard navigation. Pigsty ships with a ready-to-use small app PGLOG for analyzing PostgreSQL’s own CSV logs, quickly locating anomalies from logs and jumping to specific connection details.
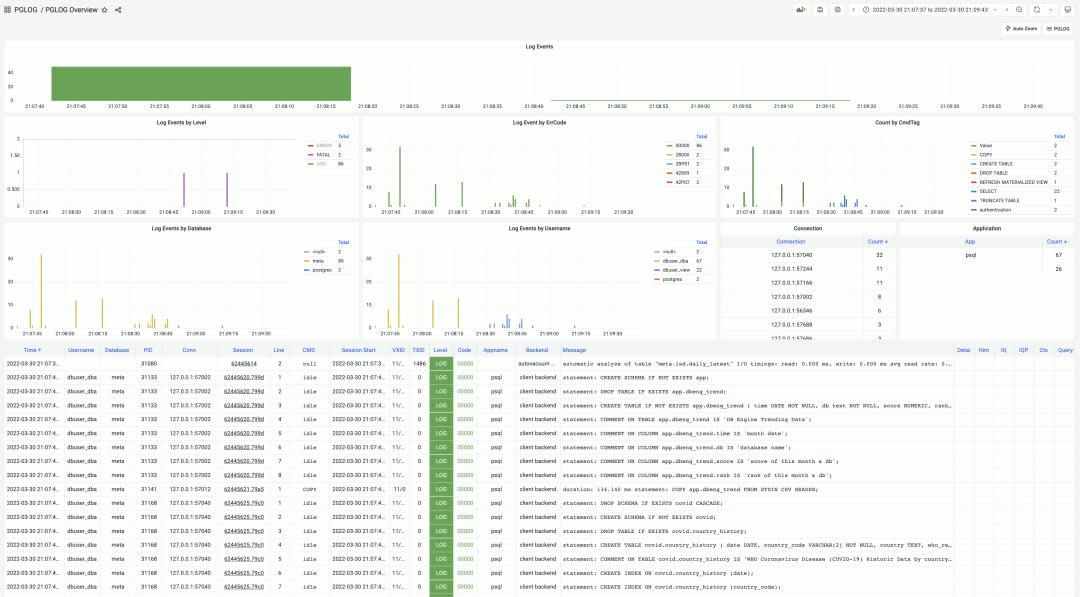
PGLOG Overview, using shortcuts to quickly load logs into application tables for analysis
Additionally, Pigsty established a dedicated code repository pigsty-app for hosting Pigsty sample applications. Current applications include:
| Application | Description |
|---|---|
| ISD | NOAA global surface weather station historical weather data query |
| COVID | WHO COVID-19 pandemic data query |
| DBENG | DB-Engine database popularity trends and predictions |
| APPLOG | Apple app privacy log visualization |
| WORKTIME | Work hours at major tech companies |
More data application examples will be added continuously.
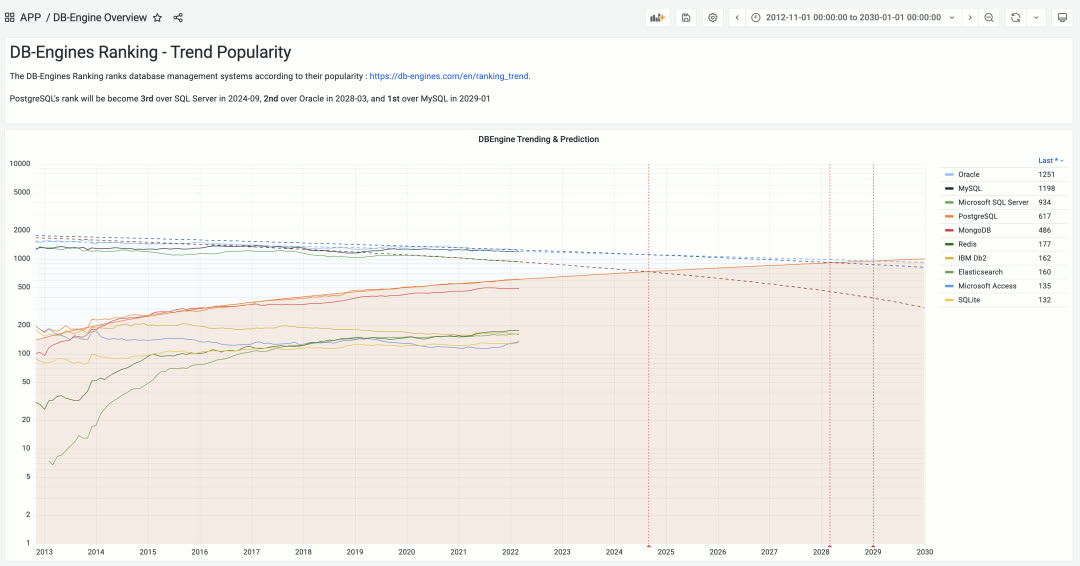
DBEng Trend: Using authoritative DB-Engines popularity data to predict when PostgreSQL will become the world’s most popular relational database
Installation Experience / CDN#
Previously Pigsty used GitHub as the release platform, which was difficult to access from mainland China. So we enabled a global CDN domain http://download.pigsty.cc. For example, the latest source package and offline package download URLs are:
http://download.pigsty.cc/v1.4.0/pigsty.tgz  (2MB)
http://download.pigsty.cc/v1.4.0/pkg.tgz     (940MB)
Pigsty’s software packages were reorganized and slimmed down from 1.3GB to 940MB in v1.4. Users needing Greenplum and MatrixDB can download a separate offline package matrix.tgz (338MB).
Pigsty v1.4 provides a dedicated download script download for automatically downloading and extracting optional packages pkg.tgz, matrix.tgz, app.tgz. This script auto-detects network environment, using GitHub Releases outside the GFW and Tencent Cloud CDN inside China.
The Pigsty installation process is now:
bash -c "$(curl -fsSL http://download.pigsty.cc/get)" # Download
./download pkg matrix app   # Download and extract optional packages (optional)
cd ~/pigsty && ./configure  # Configure
make install                # Install
Case Study: Tantan#
Tantan is Pigsty’s largest user case. In March 2022, Tantan decommissioned the last legacy PostgreSQL database pg.meta.tt, with all production databases migrated to Pigsty. One hundred clusters are all managed by Pigsty v1.3.1 (with v1.4 monitoring). Auto-failover is enabled for all clusters, marking the official completion of the two-year Database Ascension Project.
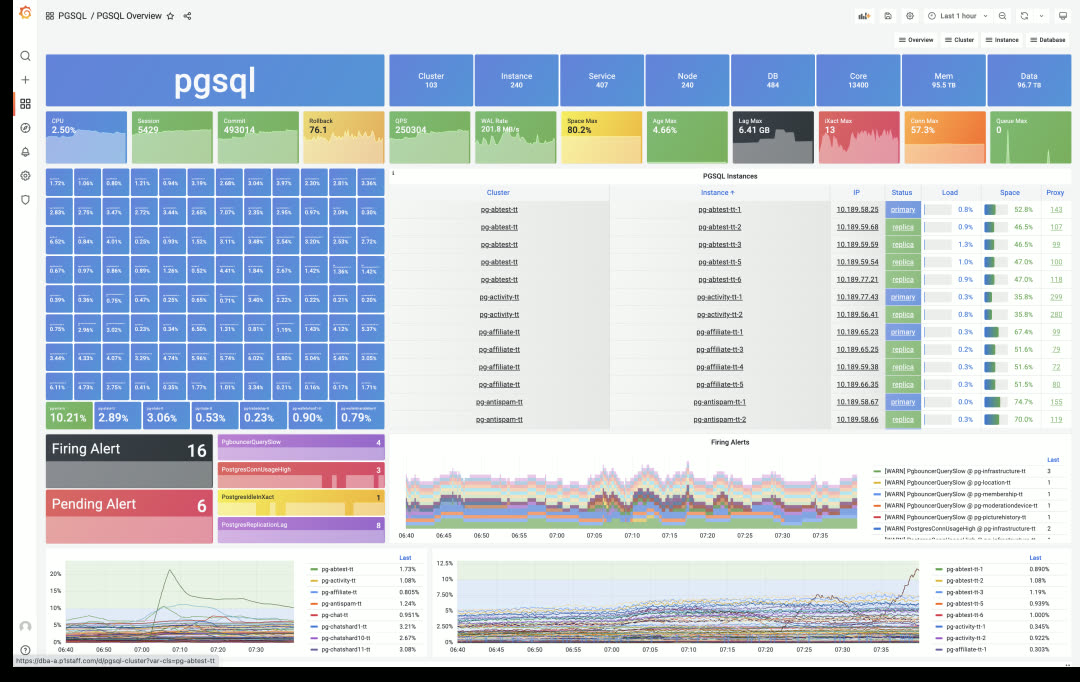
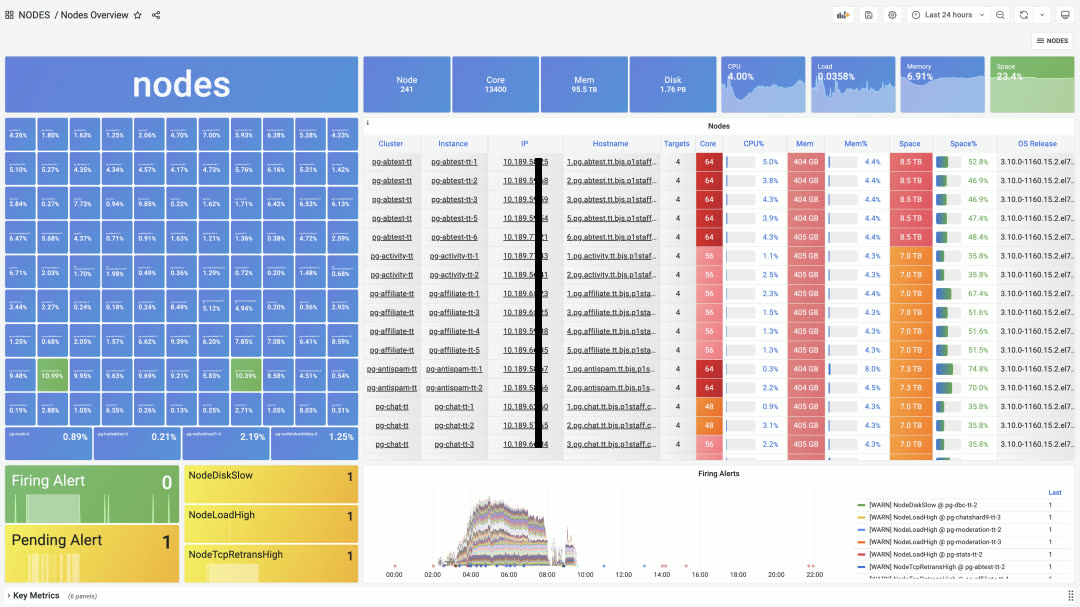
Tantan’s main production Pigsty deployment: 240 instances, 13,400 cores of PostgreSQL OLTP clusters
At Tantan, Pigsty underwent long-term, large-scale, rigorous production testing. Over two years of continuous refinement led to what it is today. In recent chaos engineering drills, ops randomly selected database machines for multiple crash tests. Pigsty automatically performed HA primary-replica/traffic failover with no human intervention. Replica crashes had no business impact; primary crashes affected business writes for less than 1 minute.
A typical replica crash scenario: read traffic quickly handled by primary, only a few in-flight queries interrupted, then immediate recovery
A typical primary crash scenario: 30s after primary goes down, replica is promoted to new primary, 30s of business write impact then self-healing
v1.4.0 Release Notes#
Architecture#
- Decoupled system into 4 major categories:
INFRA,NODES,PGSQL,REDIS, making Pigsty clearer and more extensible - Single-node deployment =
INFRA+NODES+PGSQL - PGSQL cluster deployment =
NODES+PGSQL - Redis cluster deployment =
NODES+REDIS - Other database deployment =
NODES+ xxx (e.g.,MONGO,KAFKA…)
Accessibility#
- CDN for mainland China
- Use
bash -c "$(curl -fsSL http://get.pigsty.cc/latest)"to get latest source - New
downloadscript to download and extract packages
Monitoring Enhancements#
- Split monitoring into 5 categories:
INFRA,NODES,REDIS,PGSQL,APP - Logging enabled by default
lokiandpromtailnow enabled by default, with prebuilt loki-rpm
- Model and labels
- Added hidden
dsprometheus datasource variable to all dashboards - Added
iplabel to all metrics, used as join key between database and node metrics
- Added hidden
- INFRA Monitoring
- INFRA main dashboard: INFRA Overview
- Added Log dashboard: Logs Instance
- PGLOG Analysis and PGLOG Session now treated as sample Pigsty APPs
- NODES Monitoring Application
- Pigsty can be used standalone as host monitoring software
- Includes 4 core dashboards: Nodes Overview & Nodes Cluster & Nodes Instance & Nodes Alert
- New identity variables for nodes:
node_clusterandnodename
- PGSQL Monitoring Enhancements
- New PGSQL Cluster, simplified and focused on what matters in a cluster
- New dashboard PGSQL Databases for cluster-level object monitoring
- PGSQL Alert dashboard now focuses solely on PGSQL alerts
- PGSQL Shard added to PGSQL
- Redis Monitoring Enhancements
- Added node monitoring to all Redis dashboards
MatrixDB Support#
- MatrixDB (Greenplum 7) can be deployed via
pigsty-matrix.ymlplaybook - MatrixDB monitoring dashboard: PGSQL MatrixDB
- Added sample configuration:
pigsty-mxdb.yml
Software Upgrades#
- PostgreSQL 14.2
- PostGIS 3.2
- TimescaleDB 2.6
- Patroni 2.1.3 (Prometheus metrics + failover slots)
- HAProxy 2.5.5 (fixed stats errors, more metrics)
- PG Exporter 0.4.1 (timeout parameters, etc.)
- Grafana 8.4.4
- Prometheus 2.33.4
- Greenplum 6.19.4 / MatrixDB 4.4.0
- Loki now provided as RPM package instead of ZIP archive
Bug Fixes#
- Removed Patroni’s Consul dependency, making migration to new Consul clusters easier
- Fixed Prometheus bin/new script default data directory path
- Added restart seconds in vip-manager systemd service
- Fixed typos and tasks
API Changes#
New Variables
node_cluster: Identity variable for node clusternodename_overwrite: If set, nodename will be set to node’s hostnamenodename_exchange: Exchange node hostnames between play hosts (in/etc/hosts)node_dns_hosts_extra: Extra static DNS records easily overridable by single instance/clusterpatroni_enabled: If disabled, postgres & patroni bootstrap not executed duringpostgresrolepgbouncer_enabled: If disabled, pgbouncer not started duringpostgresrolepg_exporter_params: Extra URL parameters for pg_exporter when generating monitoring target URLpg_provision: Boolean variable indicating whether to execute provisioning part ofpostgresroleno_cmdb: Used forinfra.ymlandinfra-demo.ymlplaybooks, won’t create CMDB on meta node
v1.4.1 Release Notes#
Bug fixes / Docker support / English documentation
Docker is now enabled by default on the meta node, allowing you to spin up various software.
Bug Fixes
- Fixed Promtail & Loki configuration variable issues
- Fixed Grafana legacy alerts
- Disabled nameserver by default
- Renamed pg-alias.sh for Patroni shortcuts
- Disabled exemplars queries for all dashboards
- Fixed Loki data directory issue
- Changed
autovacuum_freeze_max_agefrom 100000000 to 1000000000