


Pigsty v1.3 is officially released, featuring Redis support, a rebuilt PGCAT application, and enhanced PGSQL monitoring.
Redis Support#
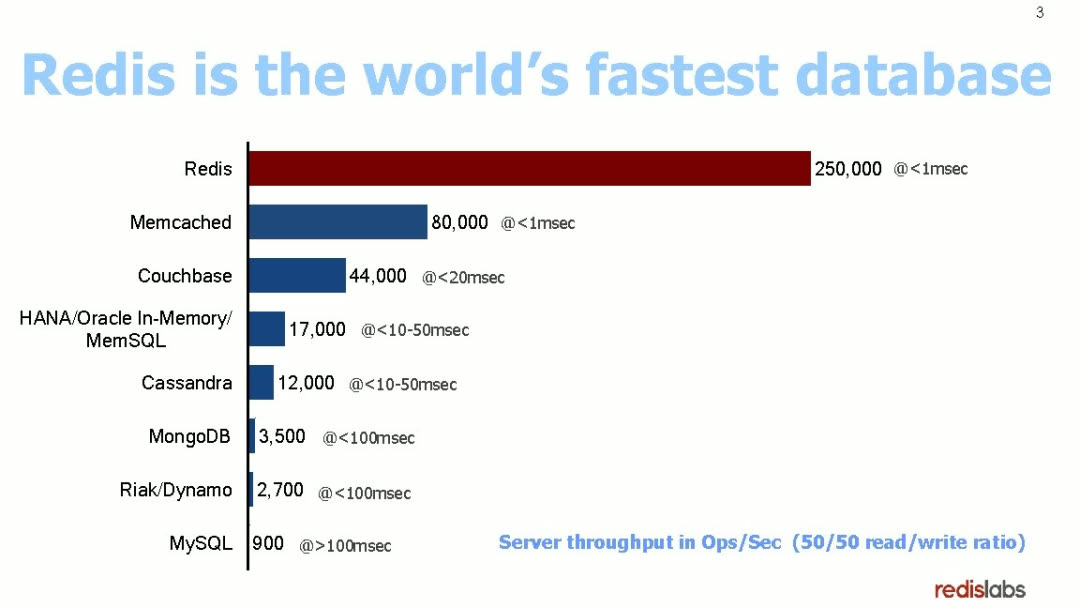
While PostgreSQL is the world’s most advanced open-source relational database, every hero needs a sidekick. Pigsty v1.3 introduces a powerful caching companion for PostgreSQL: the world’s fastest database — Redis.

Redis delivers incredible performance, easily hitting 200-300k QPS on a single core.
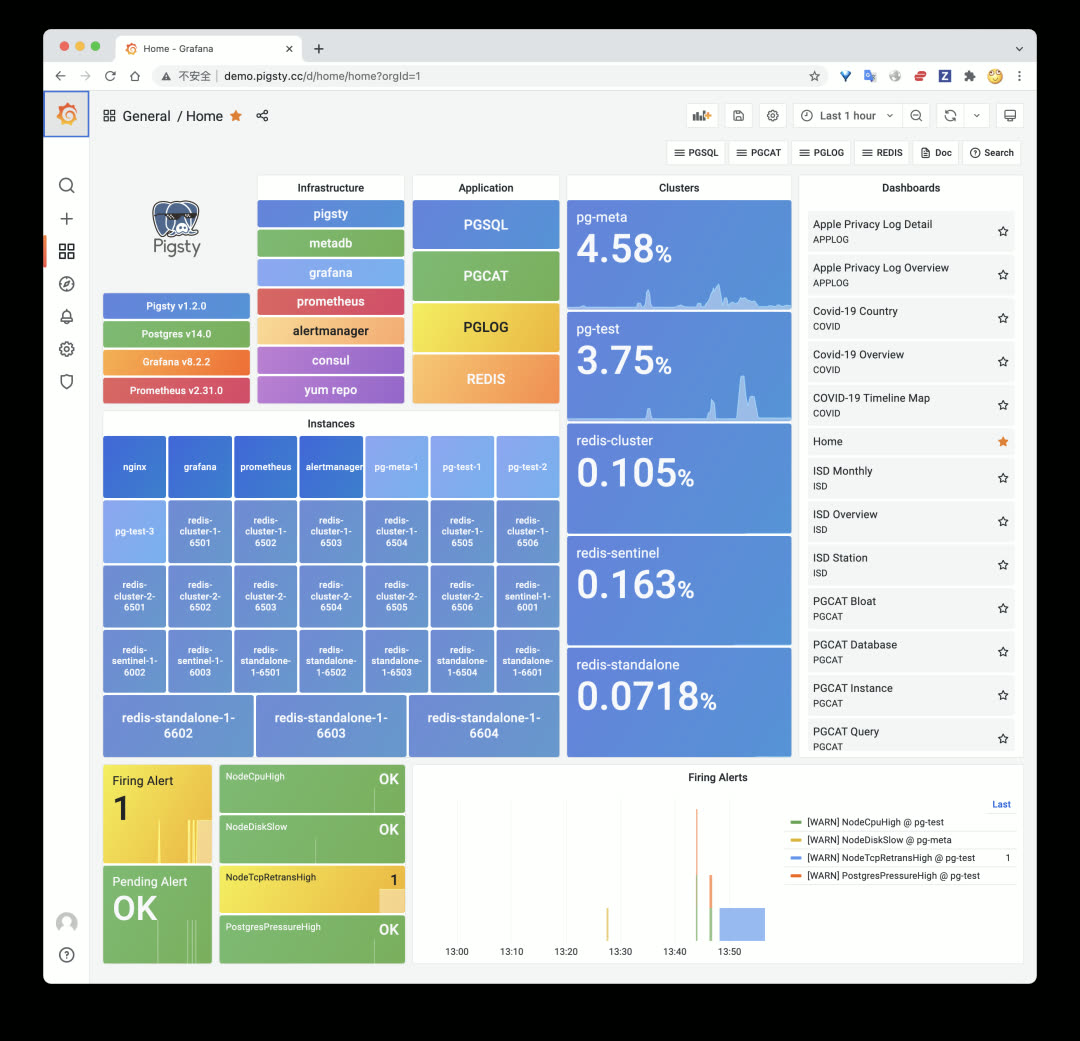
The Pigsty demo now includes Redis cluster examples:
Three Deployment Modes#
Redis has three classic deployment patterns: primary-replica (Standalone), native cluster (Cluster), and high-availability sentinel (Sentinel). Pigsty v1.3 supports all three.
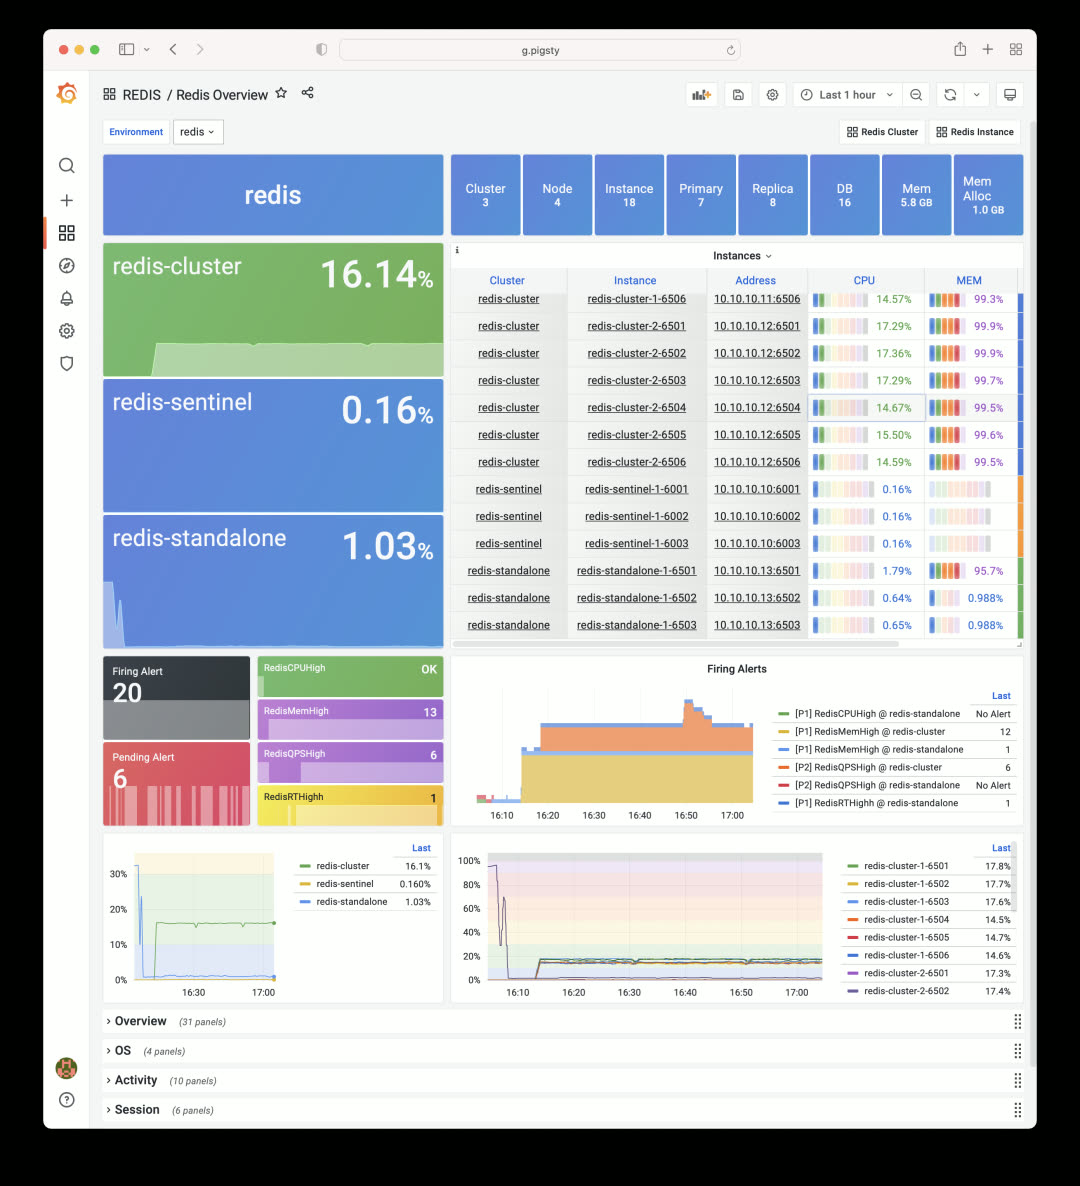
The Redis Overview dashboard shows three sample clusters, each demonstrating a different deployment mode.
Declarative Configuration#
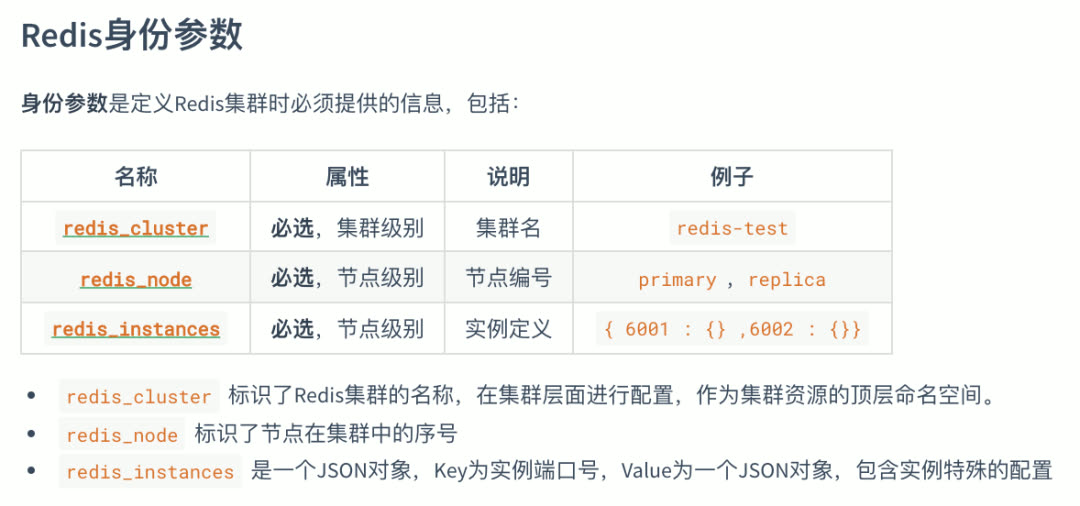
Defining a Redis cluster works the same way as PostgreSQL. After declaring your config, just run redis.yml -l <cluster> to create the cluster:
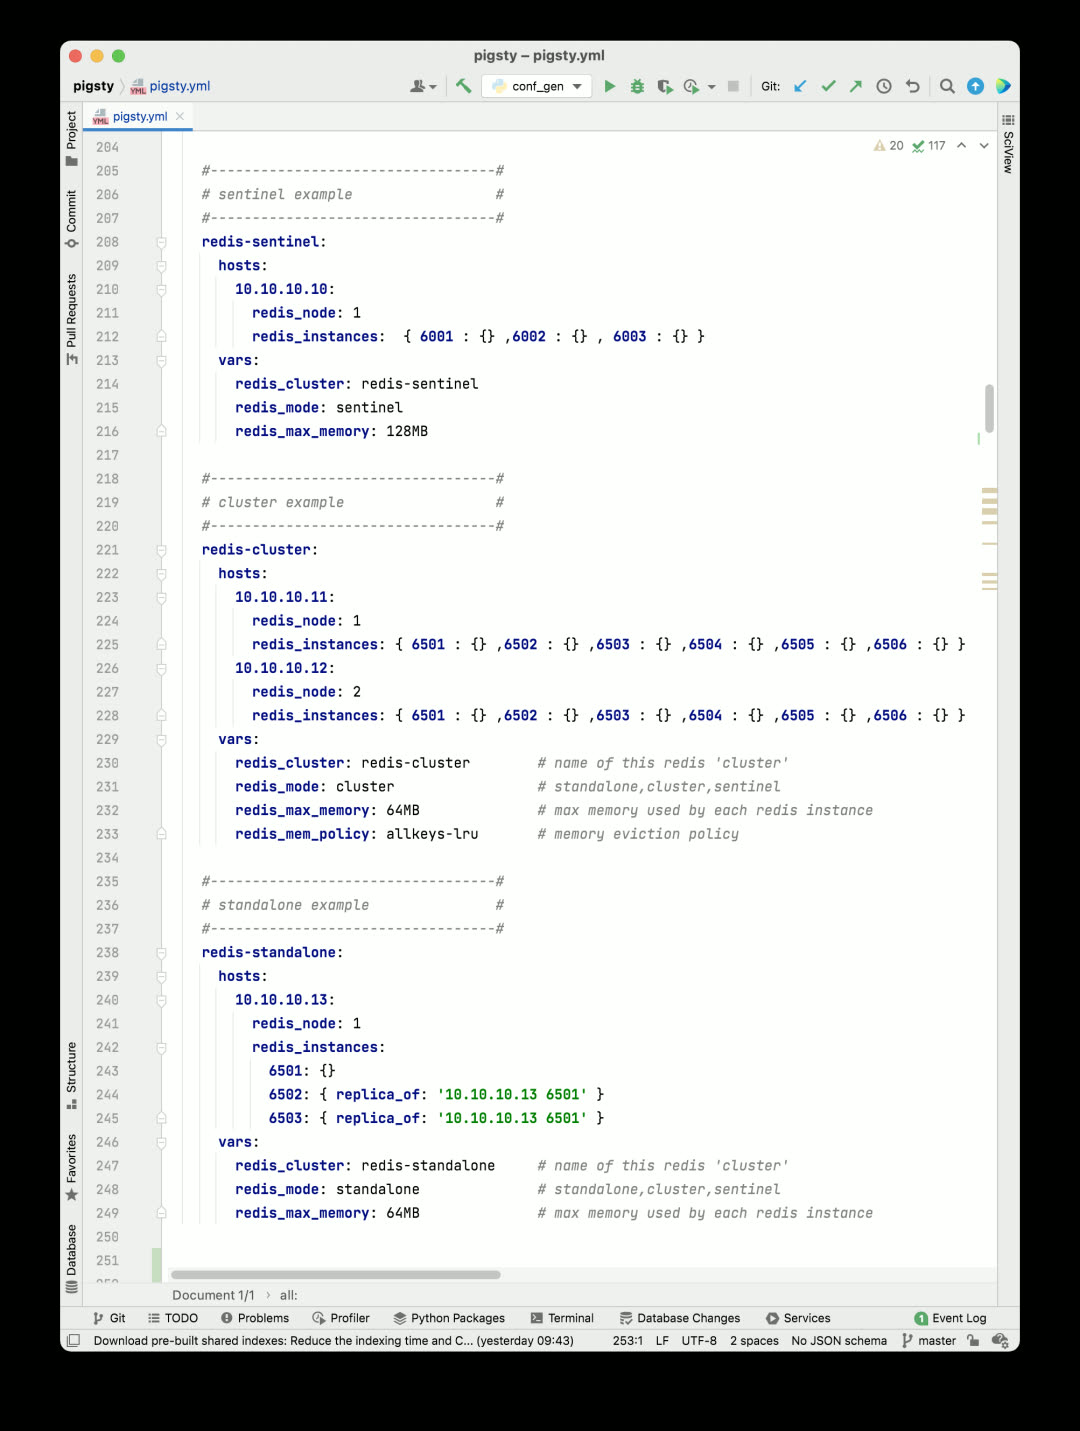
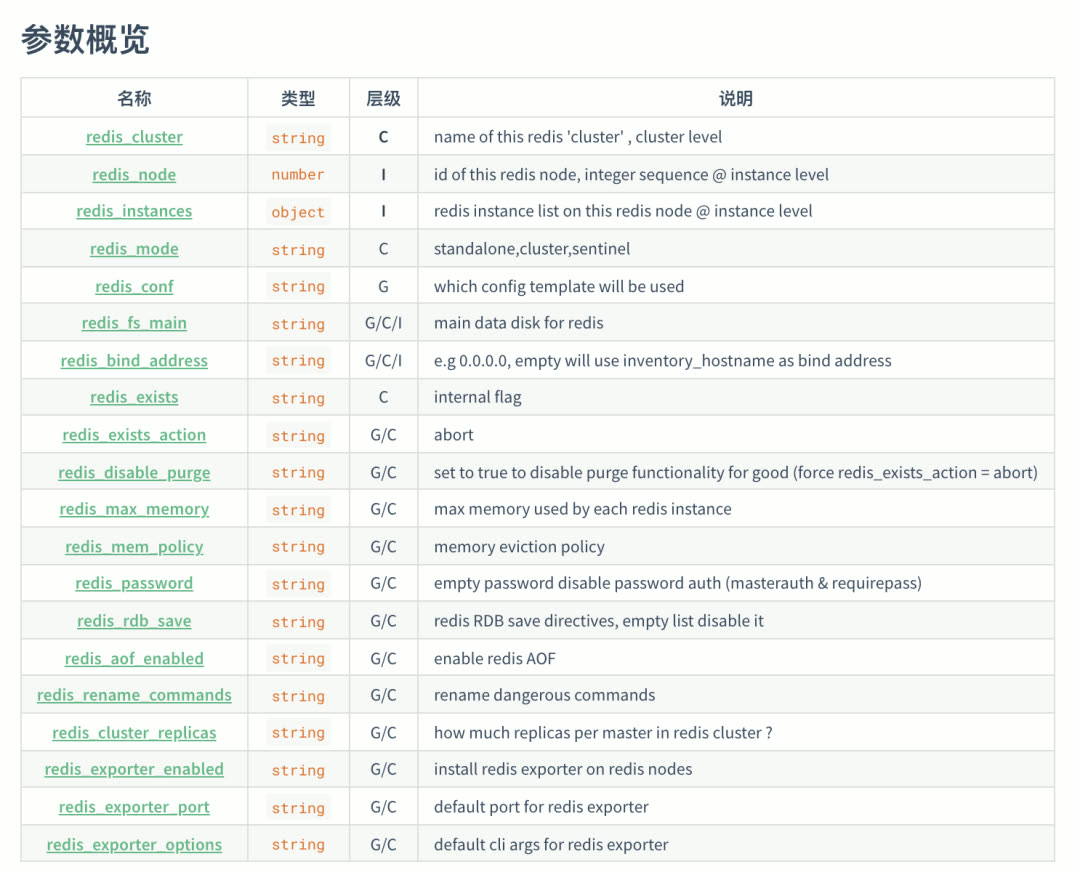
A Redis cluster only needs a few required identity parameters. Of course, you can use additional parameters for fine-grained configuration:
Auto-Monitoring#
Redis clusters and instances created with Pigsty are automatically integrated into the monitoring system.
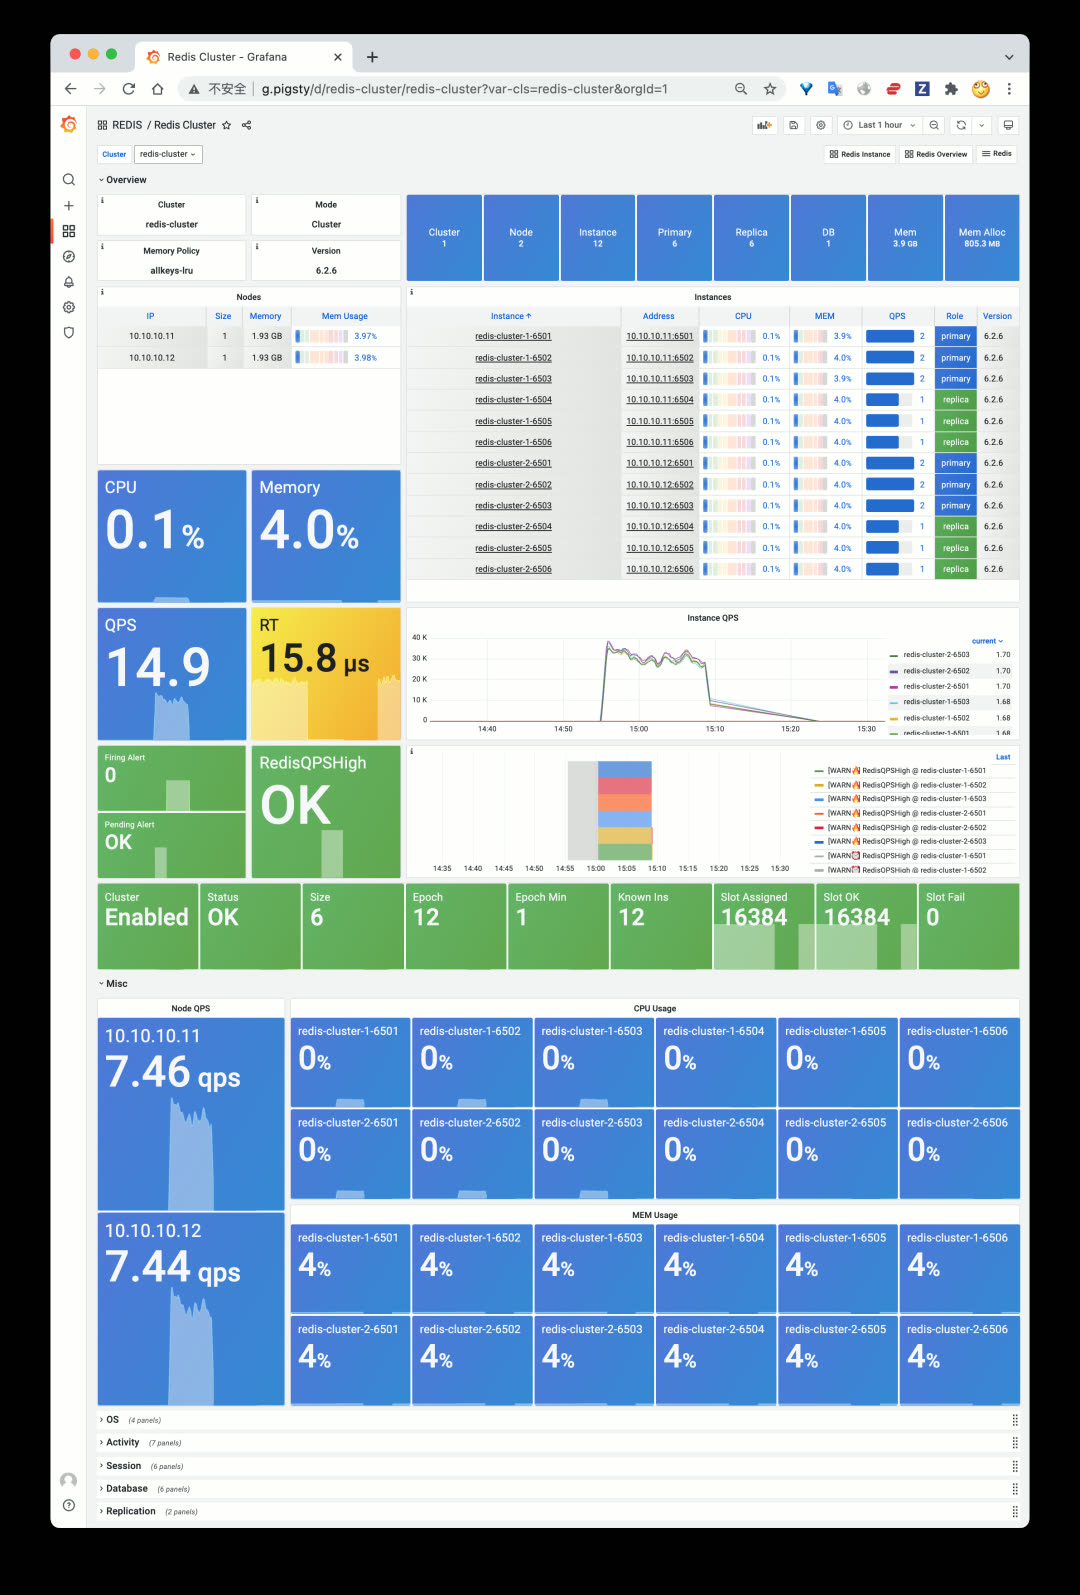
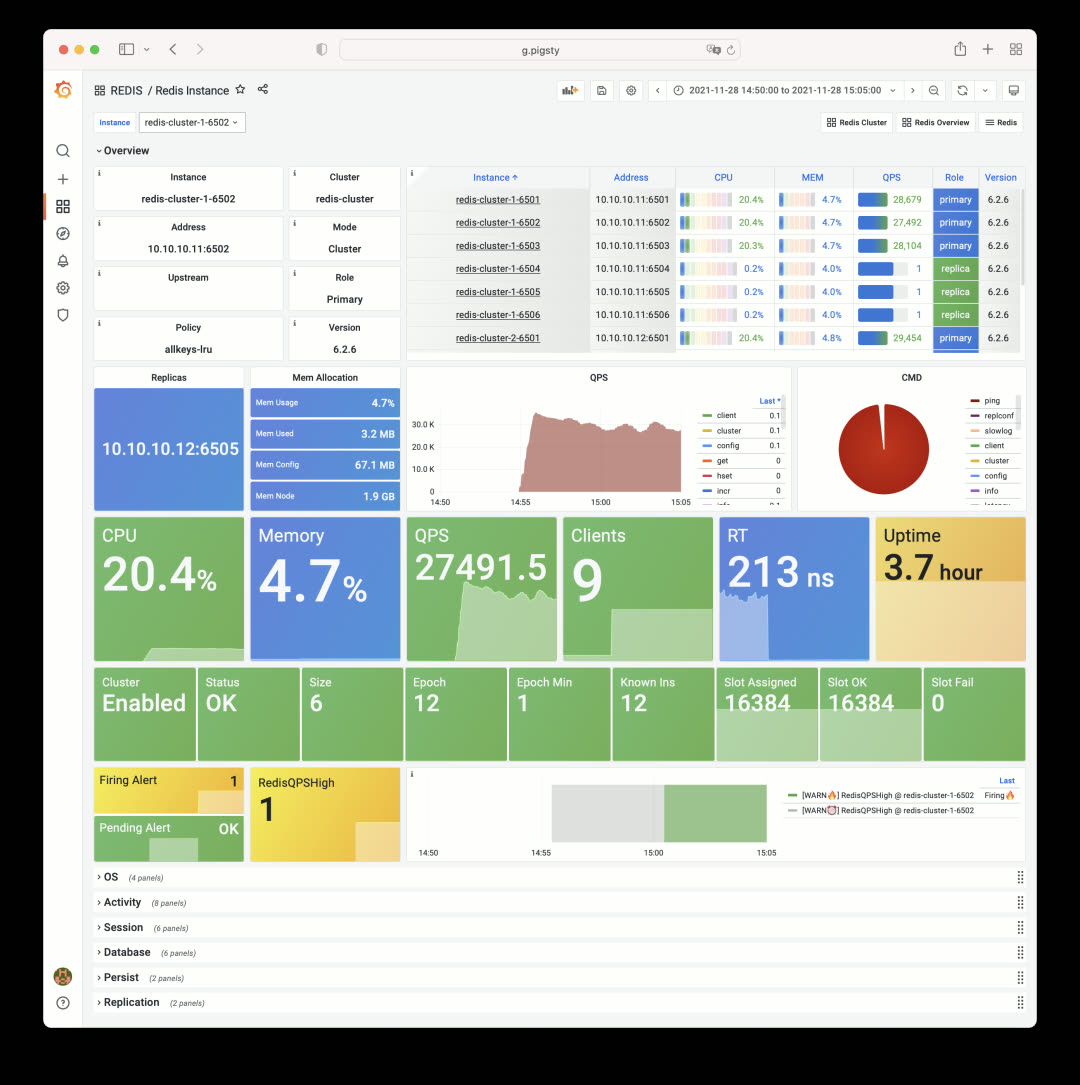
The Redis cluster dashboard homepage — click on a specific instance to jump to instance-level monitoring:
PGCAT Overhaul#
v1.3 rebuilds the PGCAT application — a tool for browsing and visualizing PostgreSQL system catalogs directly from Grafana.
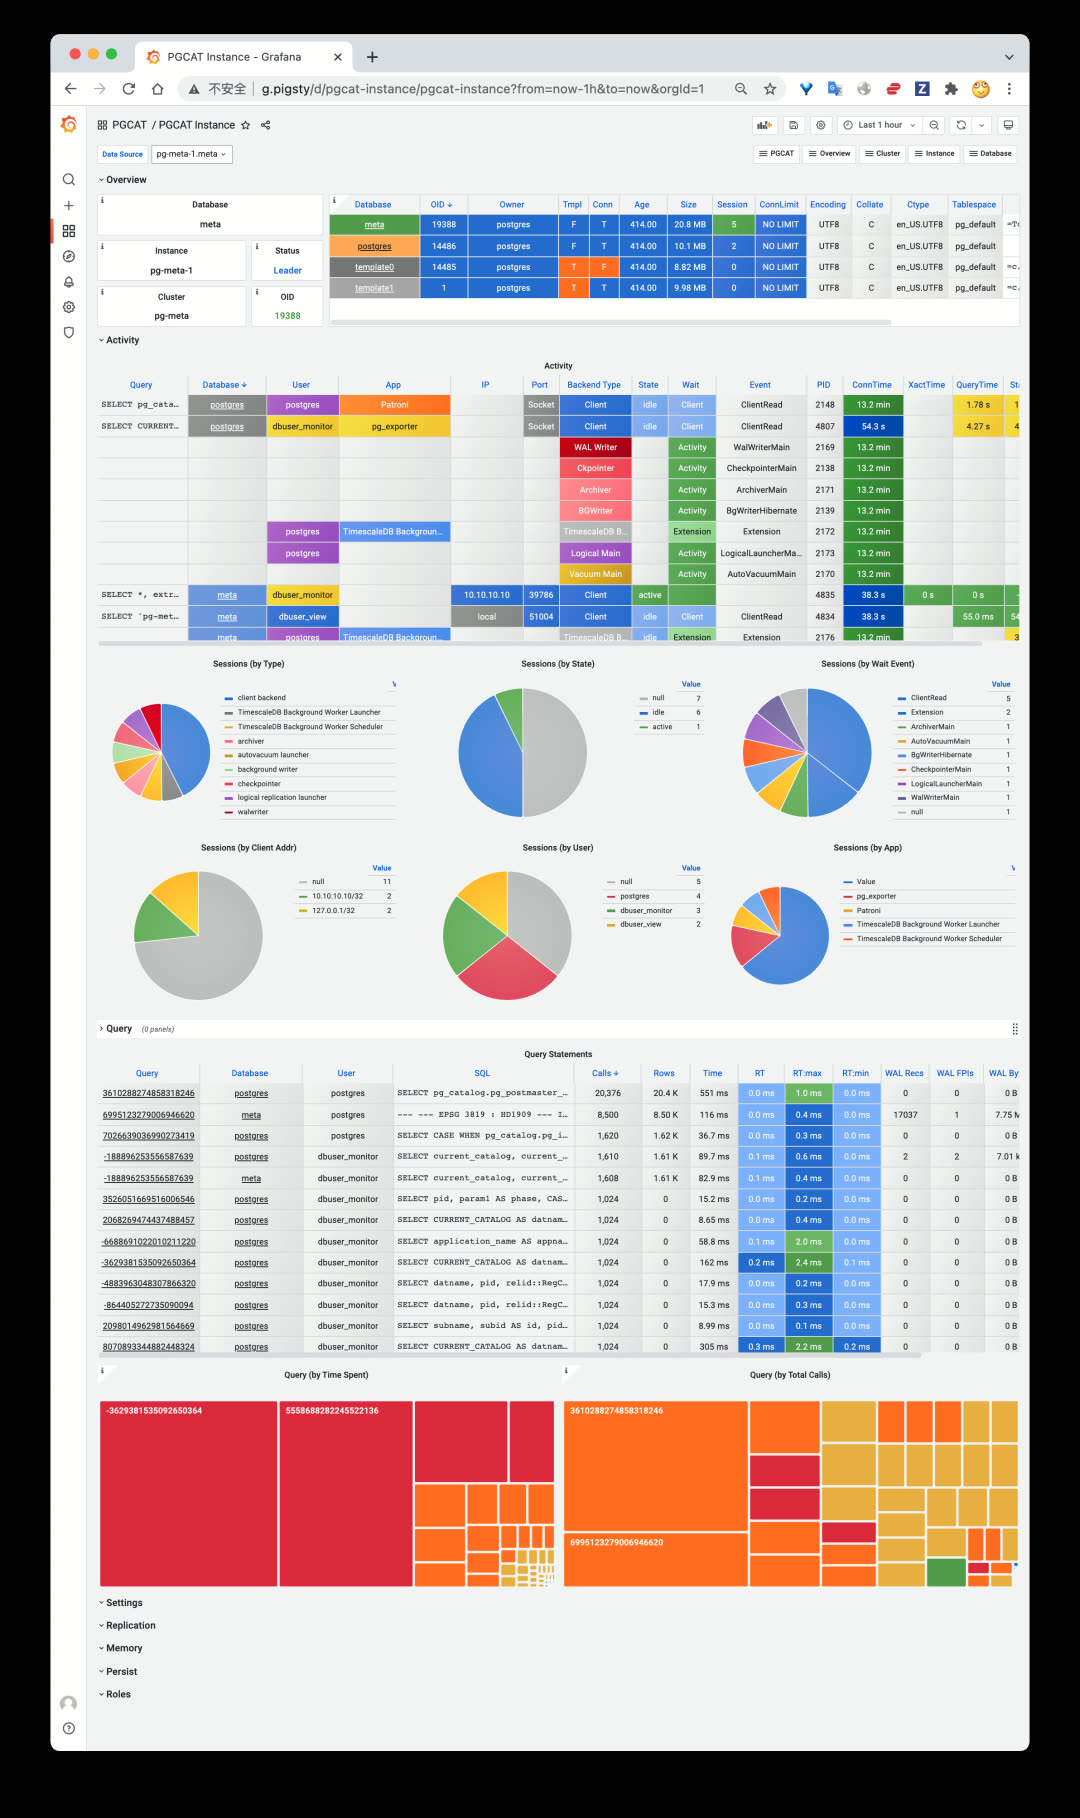
Single PostgreSQL instance catalog info: databases, active sessions, running queries.
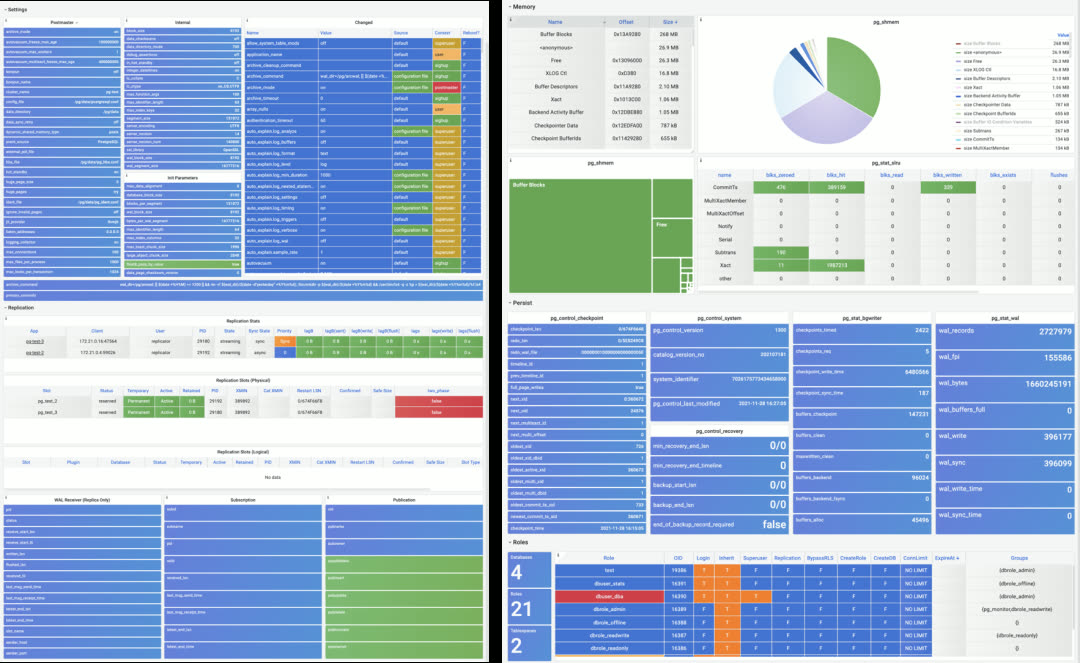
More instance-level catalog info: configuration, replication, memory usage, persistence, roles.
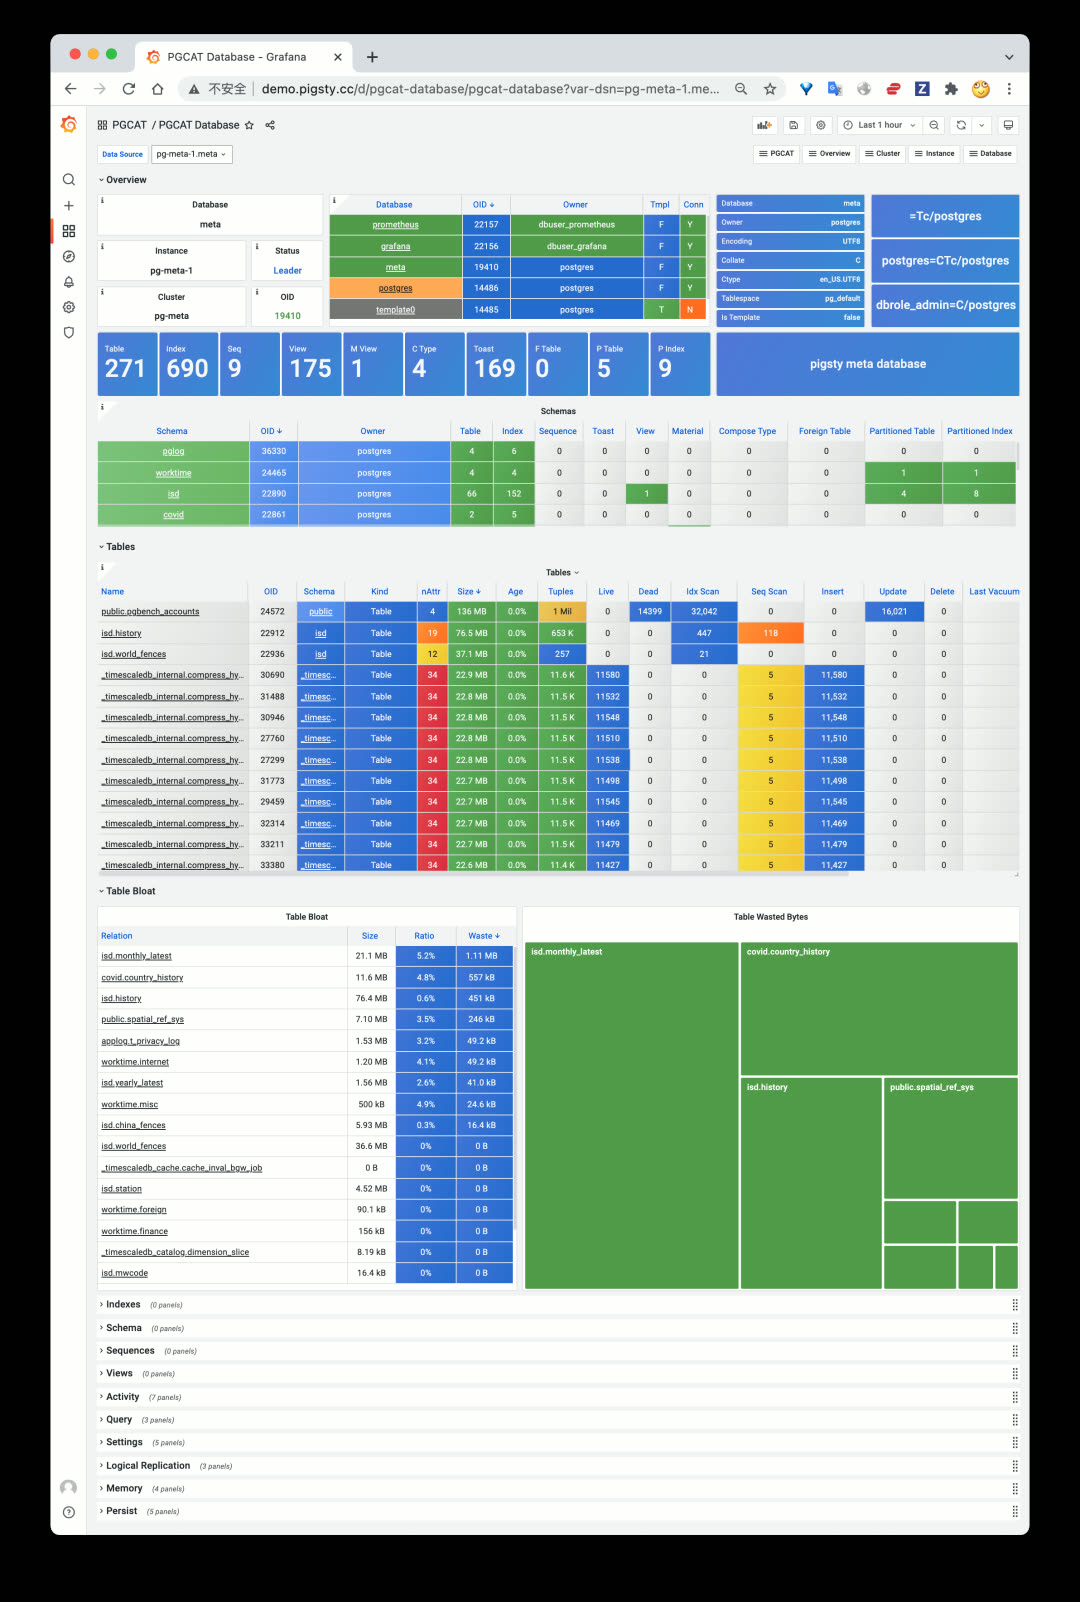
Single PostgreSQL database catalog info, including schemas, tables, indexes, sequences, and other objects.
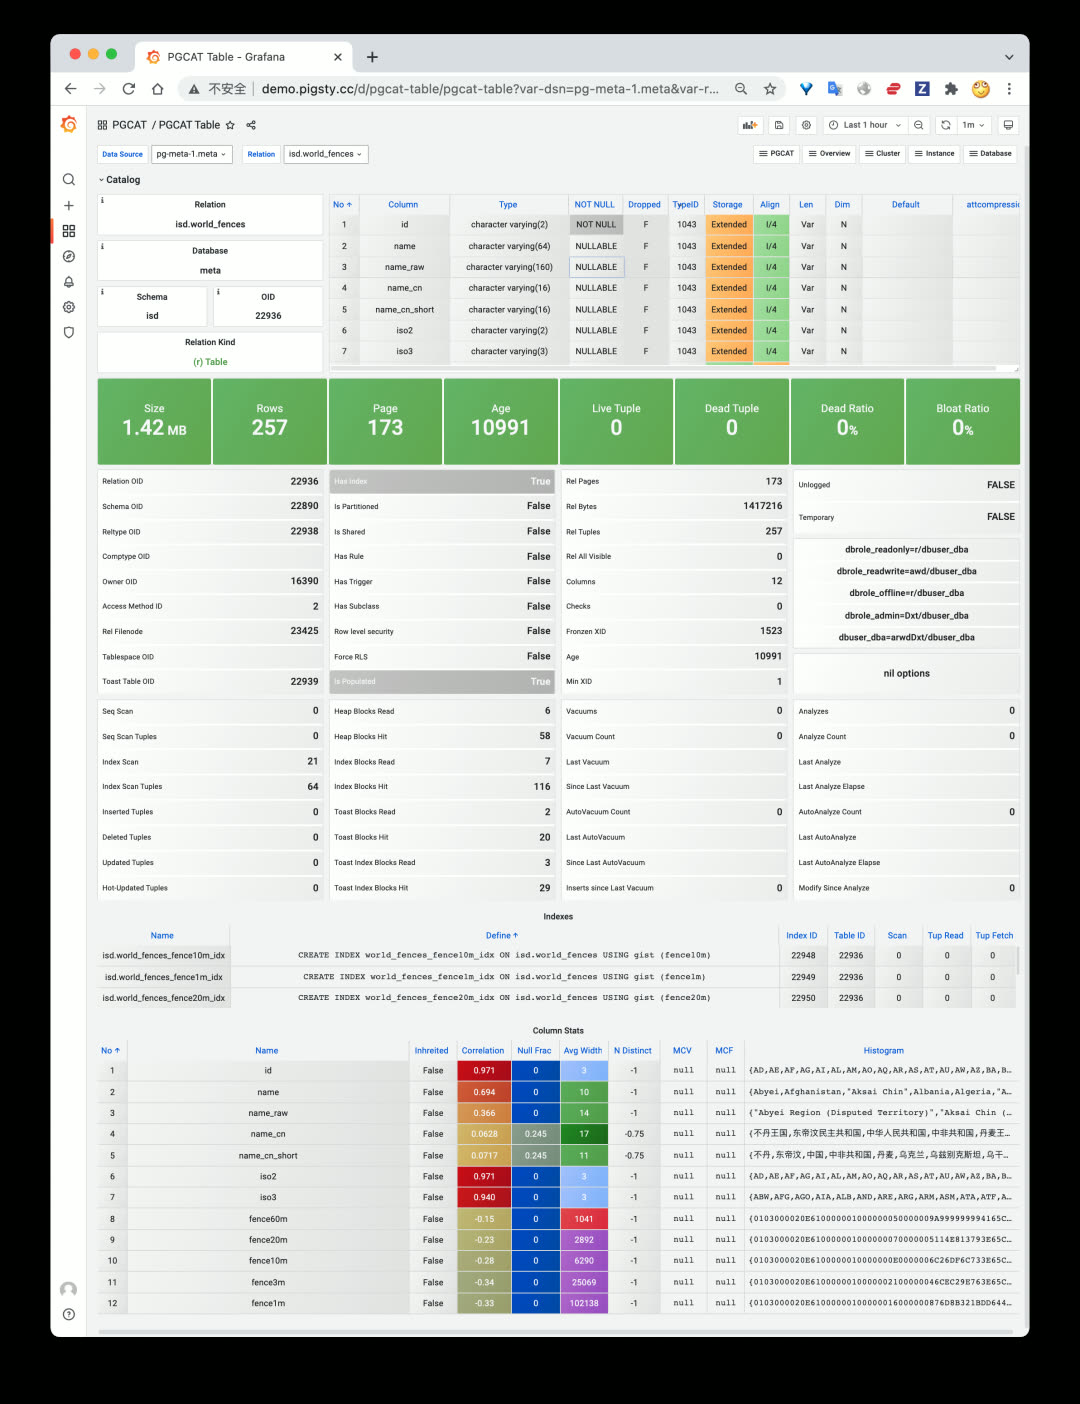
Redesigned PGCAT TABLE dashboard with detailed per-column statistics.
Agentless Design#
PGCAT only needs a target database URL — no agent installation required. Even monitor-only deployments of existing instances get full PGCAT functionality.
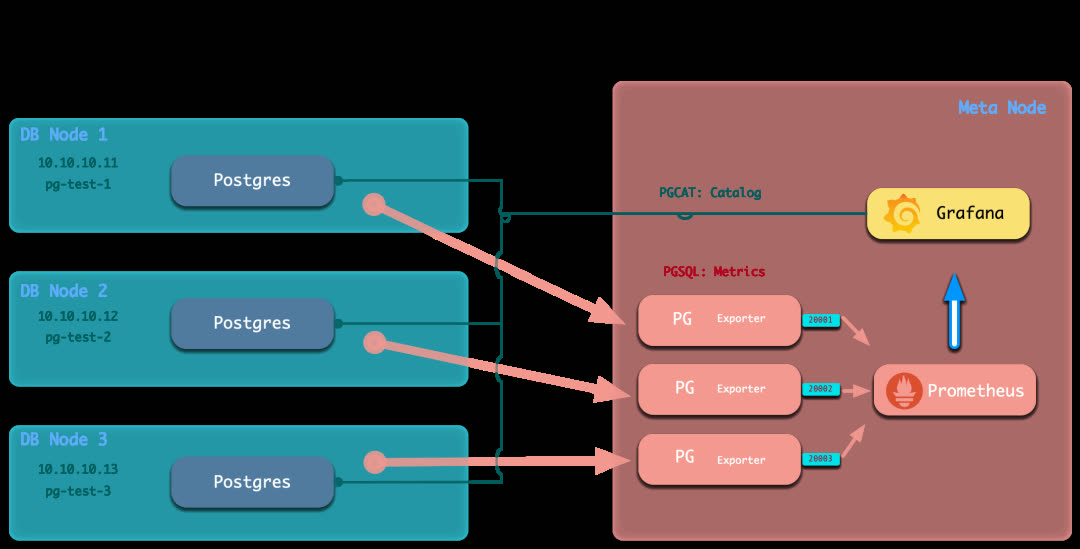
In Pigsty v1.3’s monitor-only deployment mode, external PostgreSQL instances are also registered in Grafana with PGCAT enabled by default.
PGSQL Enhancements#
The core PGSQL monitoring application also received significant improvements.
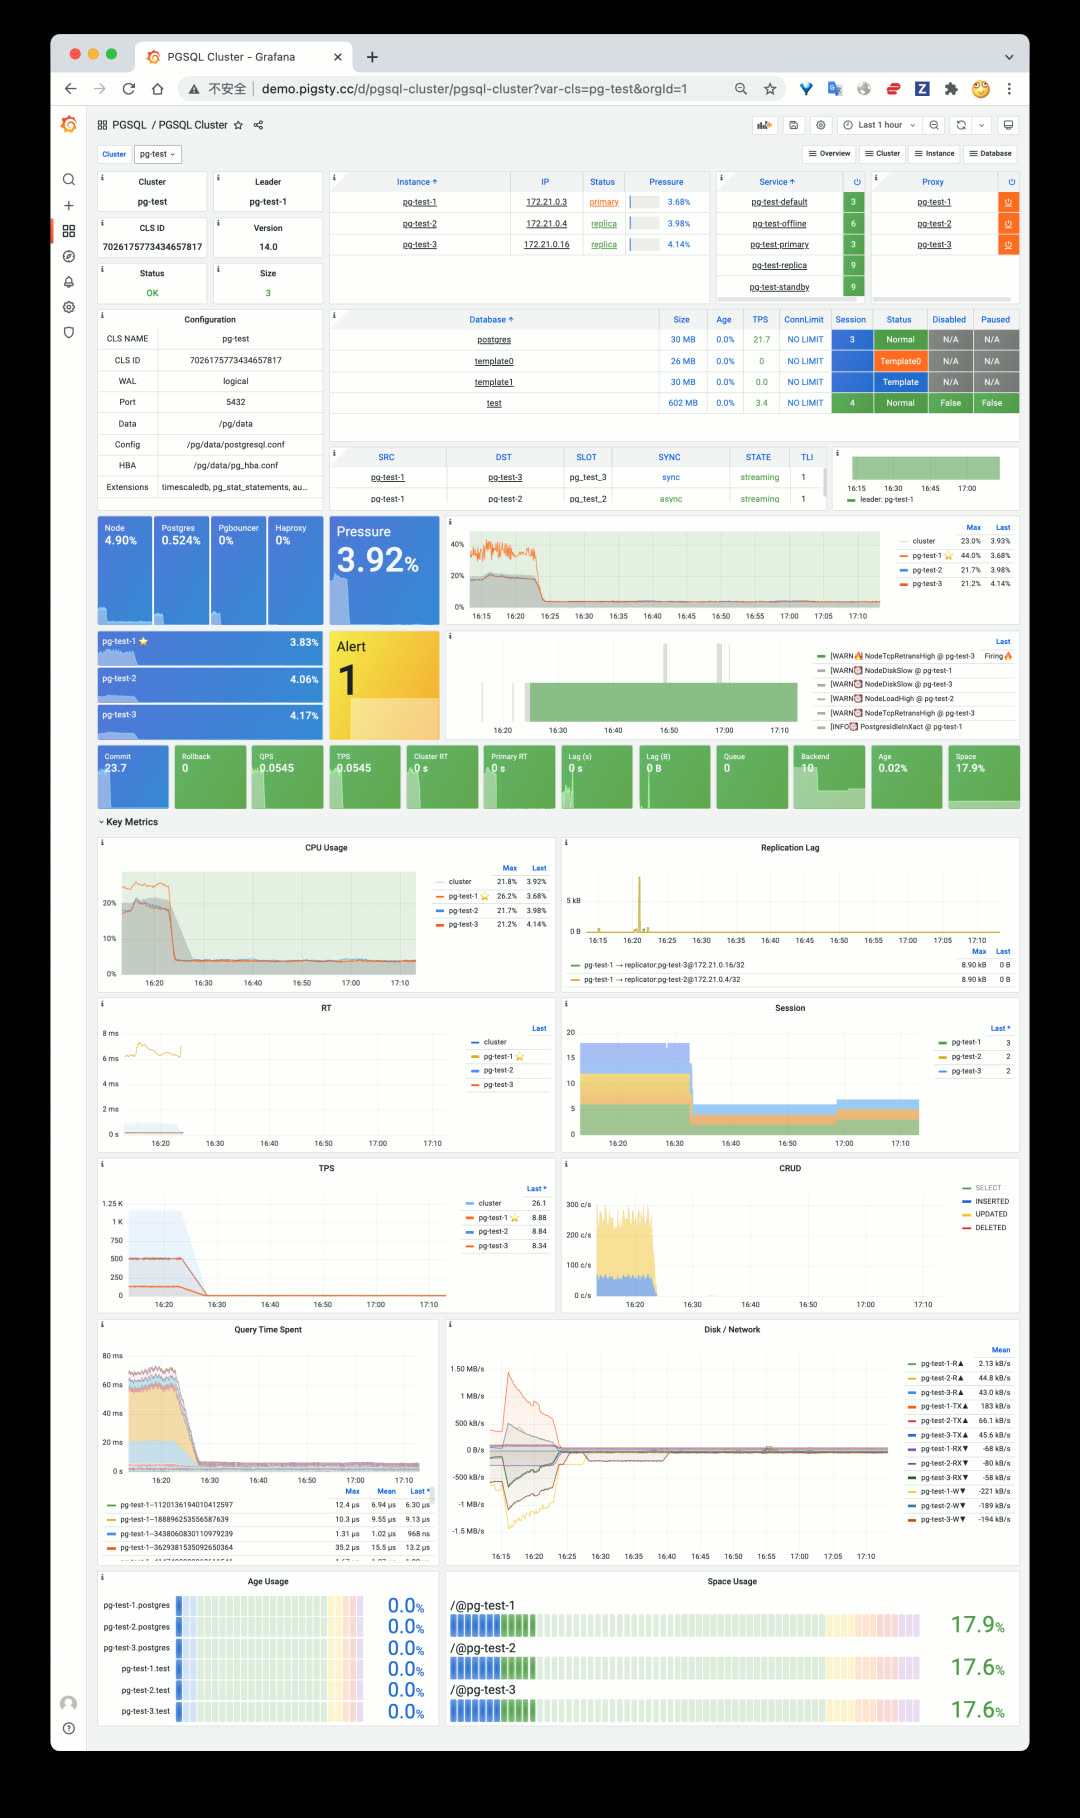
In Pigsty v1.3, the PGSQL Cluster dashboard adds quick-navigation panels for 10 key metrics.
Both PGSQL Instance and PGSQL Cluster now include quick-navigation panels for rapid problem identification. PGSQL Service was completely redesigned — simpler and more intuitive for quickly understanding cluster topology. Other dashboards also received optimizations and improvements.
Additionally, v1.3 includes improvements to the semi-automated database migration playbook and profiling tool support.
v1.3.0 Release Notes#
Redis Support
| Feature | Description |
|---|---|
| Redis Deployment | Standalone, Sentinel, and Cluster modes |
| Redis Monitoring | Overview, Cluster, and Instance dashboards |
PGCAT Overhaul
| Dashboard | Description |
|---|---|
| PGCAT Instance | New instance-level catalog dashboard |
| PGCAT Database | New database-level catalog dashboard |
| PGCAT Table | Redesigned table-level dashboard |
PGSQL Enhancements
| Dashboard | Improvements |
|---|---|
| PGSQL Cluster | Added 10 key metric panels |
| PGSQL Instance | Added 10 key metric panels |
| PGSQL Service | Simplified and redesigned |
| Cross-references | Navigation links between PGCAT and PGSQL dashboards |
Monitor Deployment
- Grafana datasources auto-register during monitor-only deployment
Software Upgrades
- PostgreSQL 13 added to default package list
- PostgreSQL upgraded to 14.1 as default
- Added Greenplum RPM packages and dependencies
- Added Redis RPM and source packages
- Added
perfas default package
v1.3.1 Release Notes#
Monitoring
- PGSQL & PGCAT dashboard improvements
- Optimized PGCAT Instance & PGCAT Database layout
- Added key metric panels to PGSQL Instance dashboard (consistent with PGSQL Cluster)
- Added table/index bloat panels to PGCAT Database, removed PGCAT Bloat dashboard
- Added index information to PGCAT Database dashboard
- Fixed broken panels in Grafana 8.3
- Added Redis index to Nginx homepage
Deployment
- New
infra-demo.ymlplaybook for one-click bootstrap - New
infra-jupyter.ymlplaybook for optional JupyterLab server - New
infra-pgweb.ymlplaybook for optional PGWeb server - Added
pgalias on meta node for starting PostgreSQL cluster from admin user - Adjusted
max_locks_per_transactionsin all Patroni config templates pertimescaledb-tunerecommendations - Added
citus.node_conninfo: 'sslmode=prefer'to config templates for SSL-free Citus usage - Added all extensions (except pgrouting) from PGDG14 to package list
- Upgraded node_exporter to v1.3.1
- Added PostgREST v9.0.0 for generating REST APIs from PostgreSQL schemas
Bug Fixes
- Grafana security vulnerability fix (upgraded to v8.3.1, details)
- Fixed
pg_instance&pg_serviceissues inregisterrole when starting playbook mid-run - Fixed Nginx homepage rendering on hosts without
pg_clustervariable - Fixed style issues when upgrading to Grafana 8.3.1