
Yesterday I tweeted: “Built a Claude Code Grafana dashboard to see how it makes decisions, uses tools, and burns through API credits.” Didn’t expect so much interest.
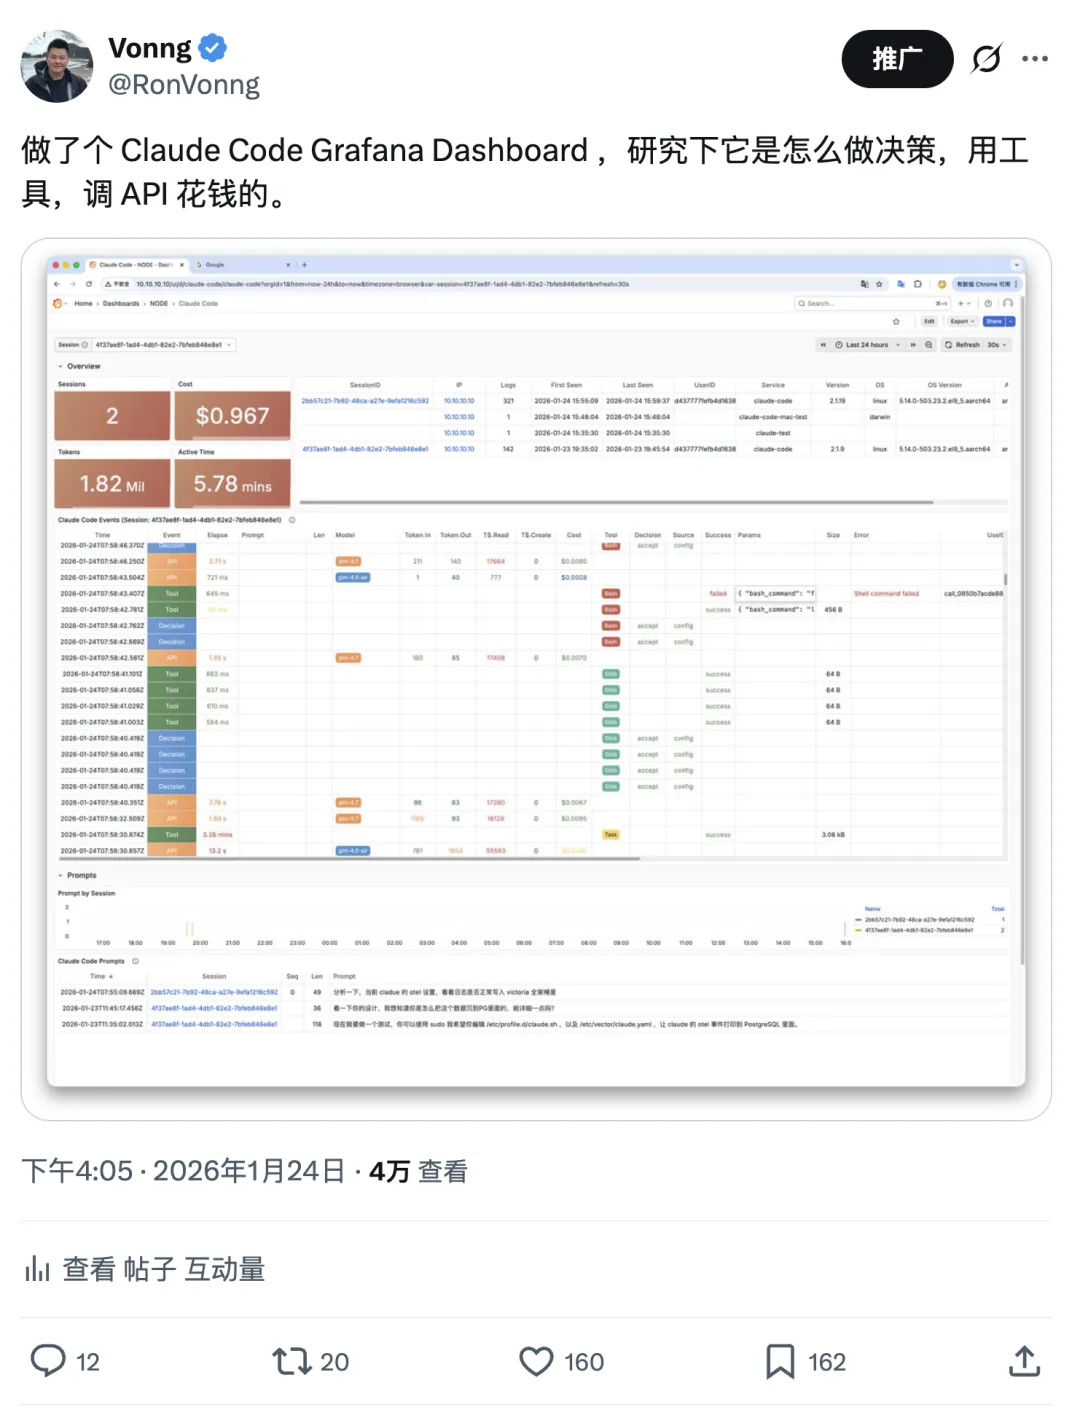
So let’s talk about Claude Code observability.
Why Observability?#
Simple idea: I want to understand Claude Code’s internals. It’s not open source (well, it was leaked once), but you can reverse-engineer its behavior through metrics and logs.
Claude Code exports OTEL-format metrics and logs. Config is straightforward — set a few env vars and it pushes to any OTEL-compatible backend. Then visualize with Grafana.
# Claude Code OTEL config
export CLAUDE_CODE_ENABLE_TELEMETRY=1             # Enable telemetry
export OTEL_METRICS_EXPORTER=otlp
export OTEL_LOGS_EXPORTER=otlp
export OTEL_EXPORTER_OTLP_PROTOCOL=http/protobuf
export OTEL_LOG_USER_PROMPTS=1                    # Set to 0 to hide prompts
export OTEL_RESOURCE_ATTRIBUTES="job=claude"      # Add your own labels
export OTEL_EXPORTER_OTLP_METRICS_ENDPOINT=http://10.10.10.10:8428/opentelemetry/v1/metrics     # VictoriaMetrics
export OTEL_EXPORTER_OTLP_LOGS_ENDPOINT=http://10.10.10.10:9428/insert/opentelemetry/v1/logs    # VictoriaLogs
export OTEL_EXPORTER_OTLP_METRICS_TEMPORALITY_PREFERENCE=cumulative
Put this in
.bash_profile,/etc/profile.d/claude.sh, or theenvfield in~/.claude/settings.json.
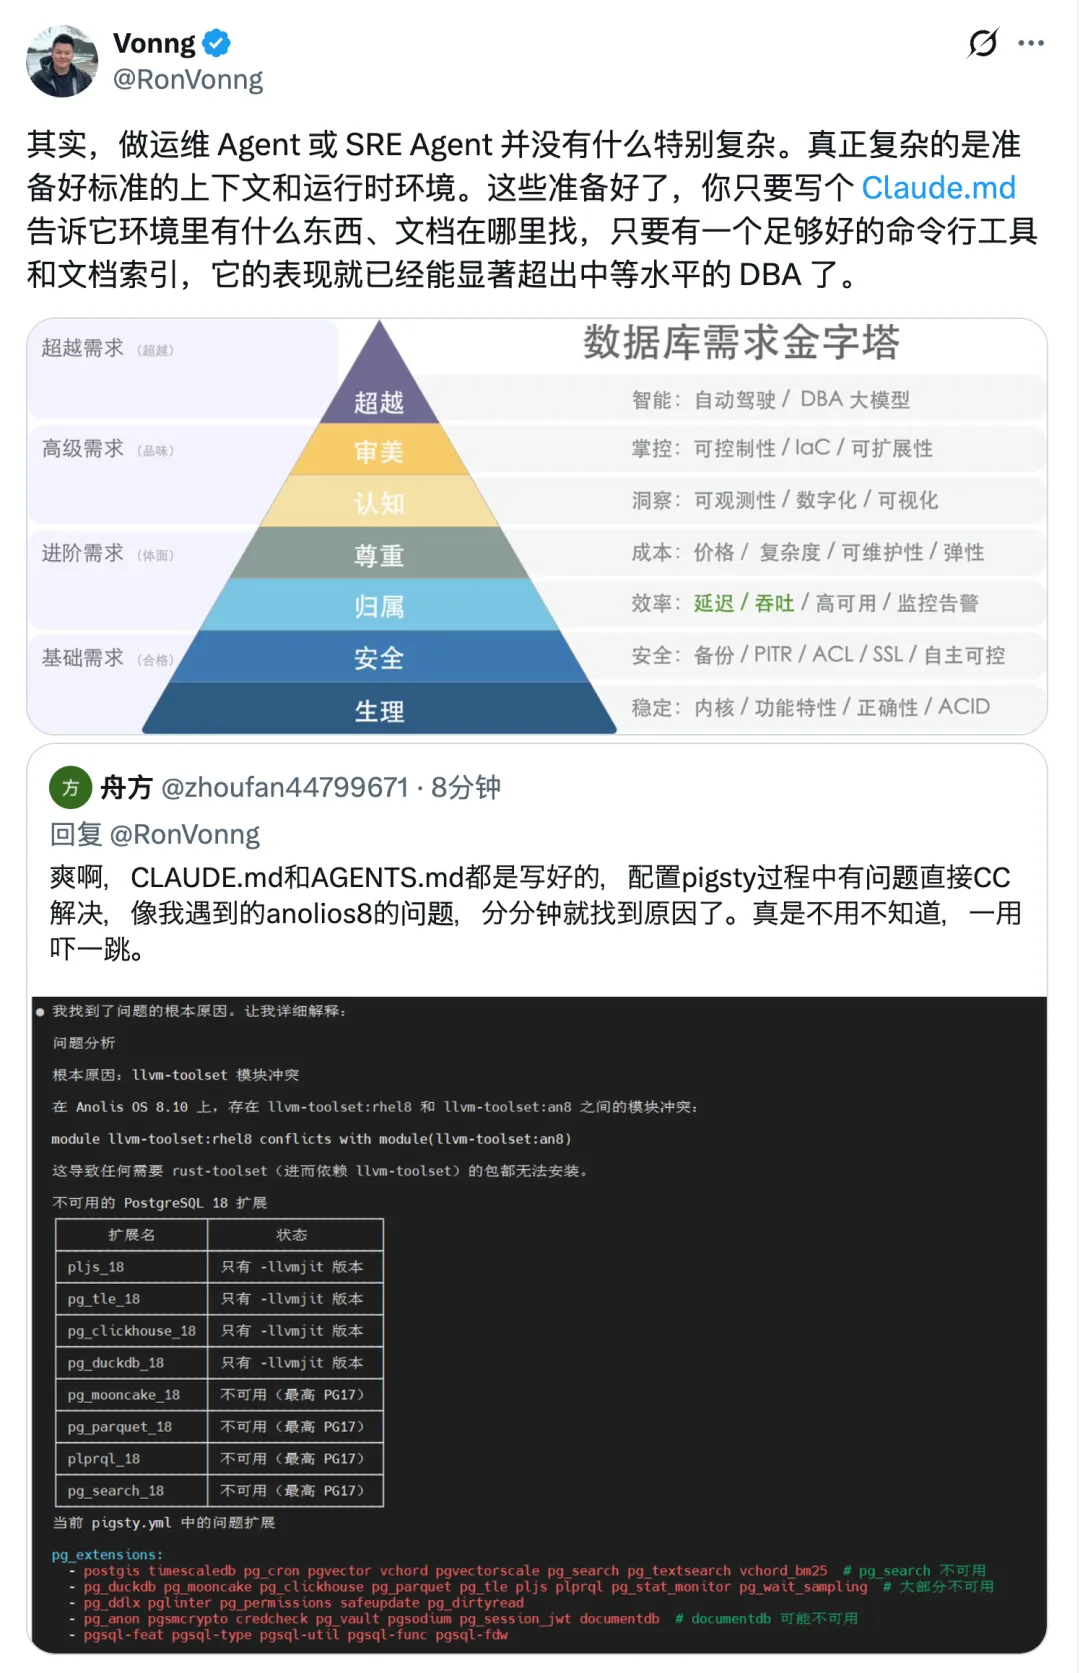
The hard part: where do you get a monitoring stack and Grafana? Seeing the demand, I built a turnkey config template.
The Monitoring Stack#
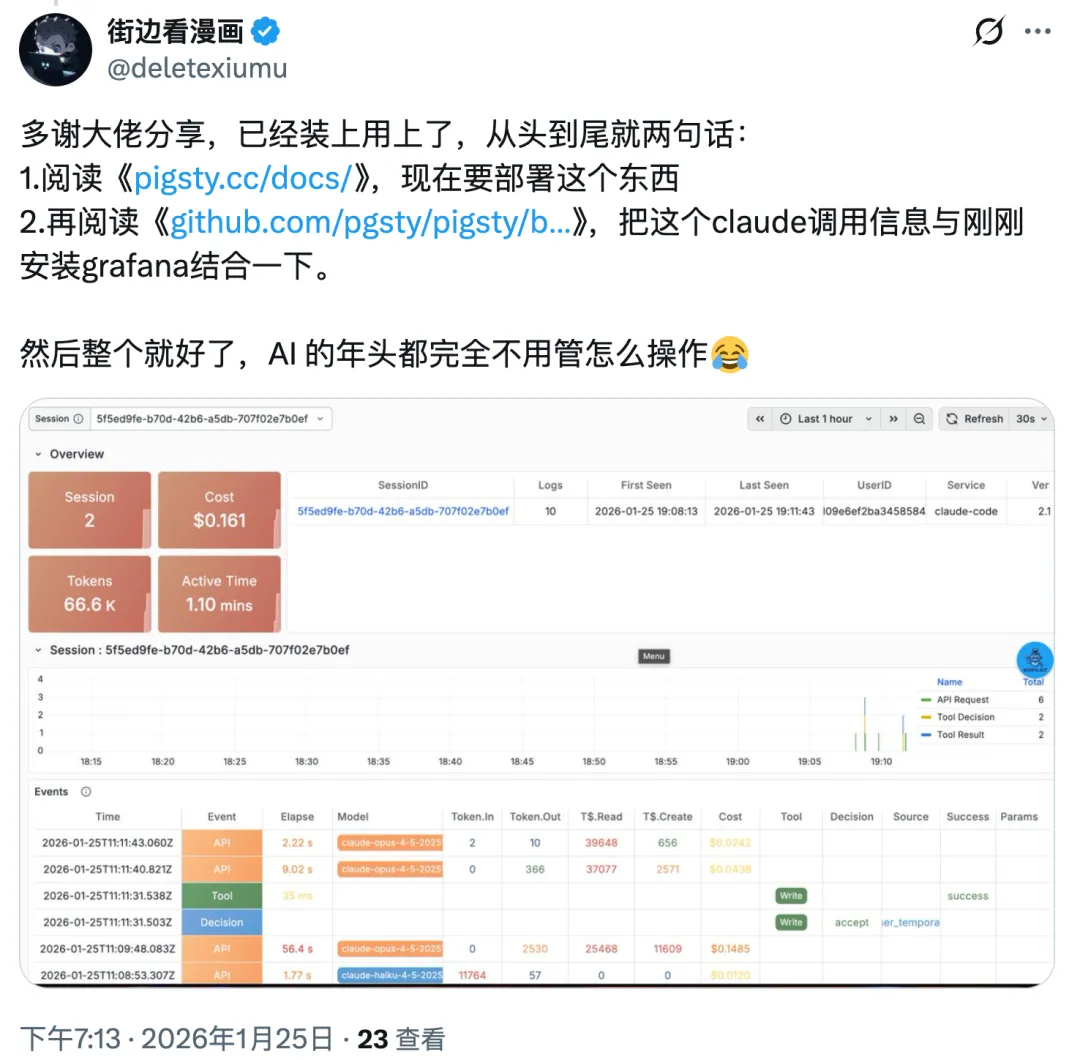
Grab a Linux box, run a few commands, and you get a complete Claude Code environment with everything pre-configured — including monitoring. Or just point your existing Claude Code at it.
Here’s the thing: if you already use Claude Code, you don’t need to understand the details. Just tell it “there’s this thing that does this” and give it a VM. It’ll figure out the rest. Saw someone in the comments say exactly that:
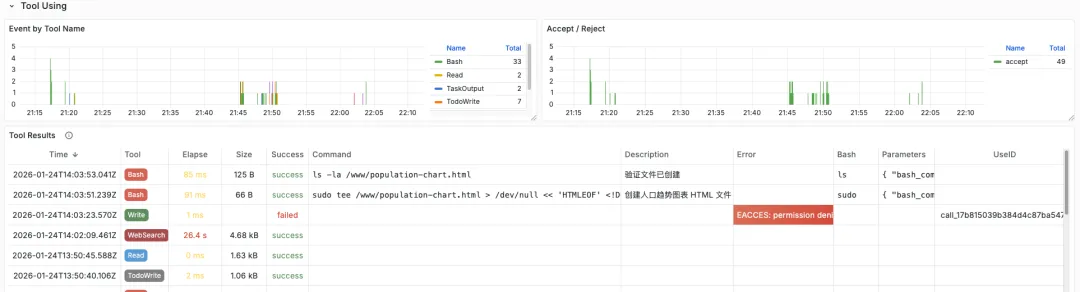
Event Types#
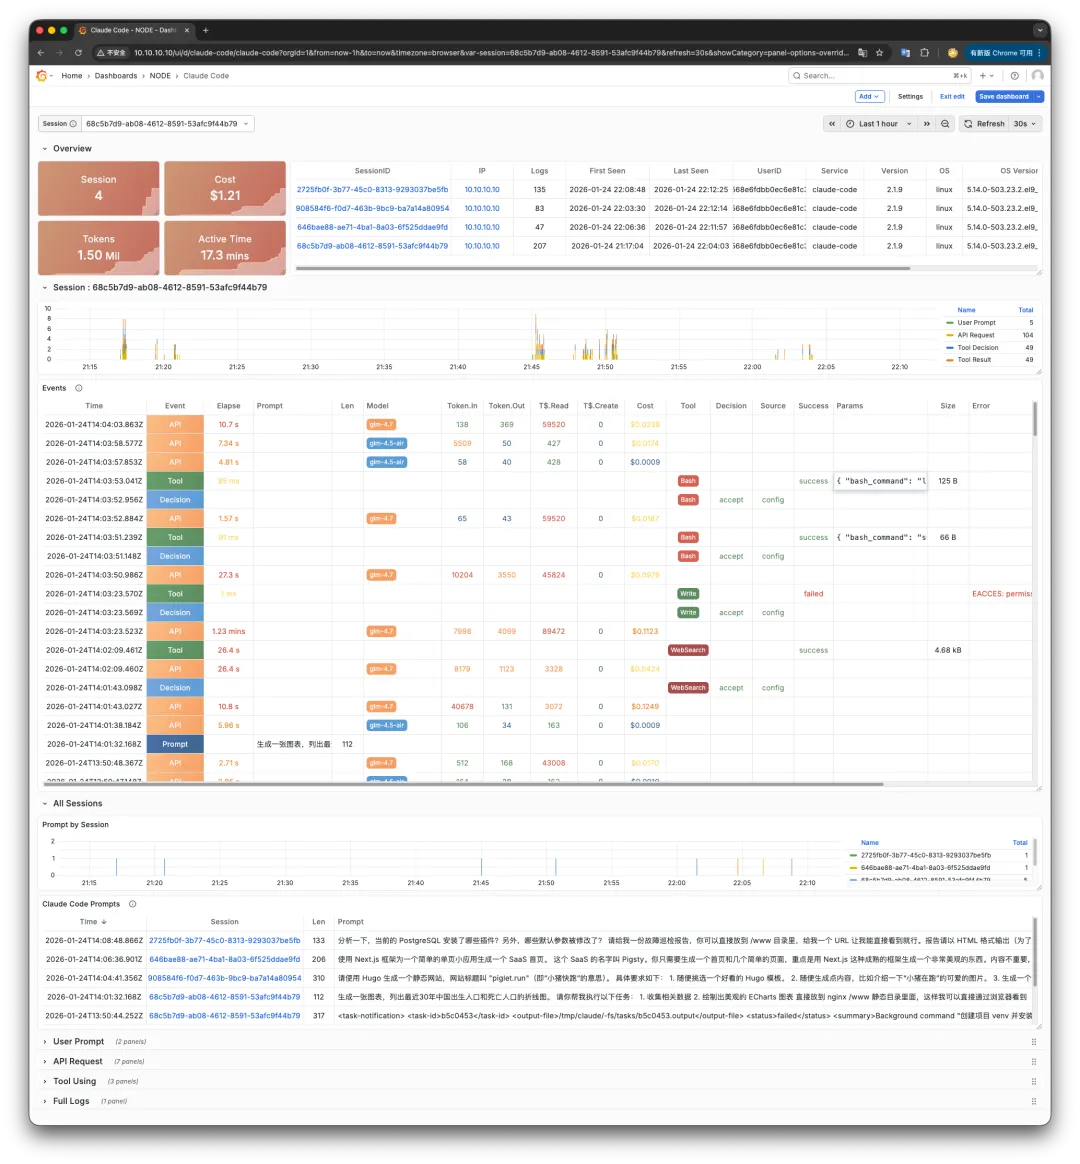
The dashboard is simple: select a session ID at the top, events appear below. Drag the timeline to see what happened during task execution.
Four main event types:
- User Prompt: What you said or the prompt you gave
- API Request: Calls to the model API
- Tool Decision: System decides which tool to use
- Tool Result: What the tool returned
Each event has its own fields. One glance at the dashboard and you understand the entire task flow.
Example: the simplest event is User Prompt. Send Claude Code a message, get an event:
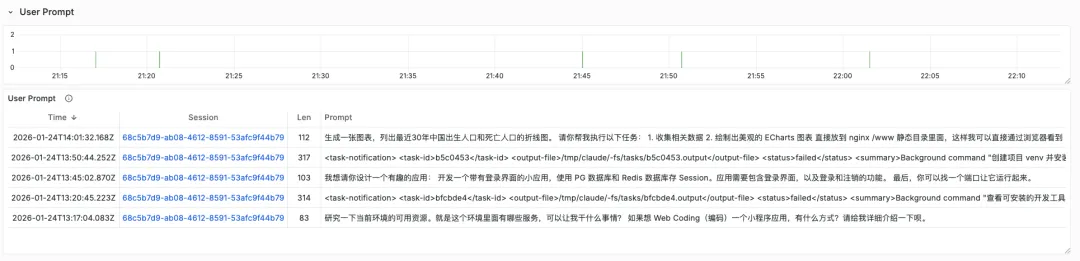
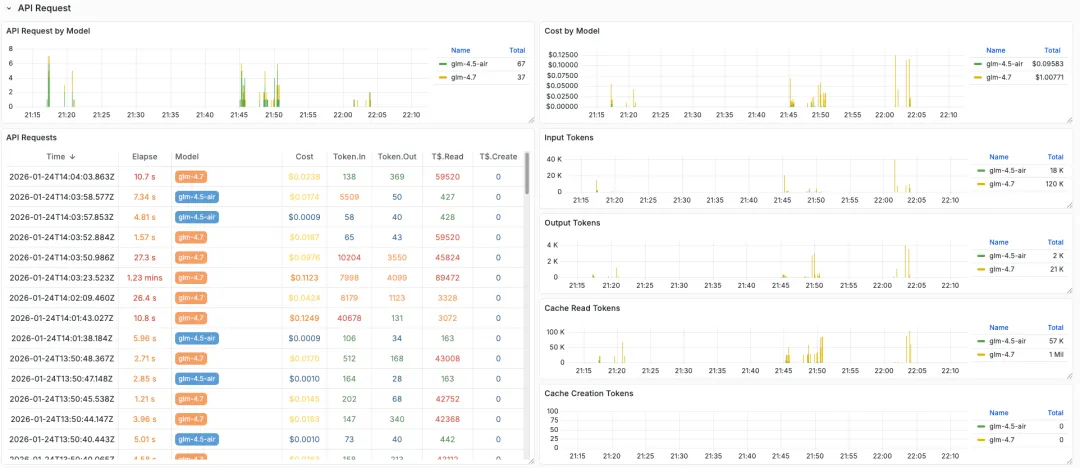
After User Prompt comes API Request — the model call. Note the model field: Claude Code distinguishes between fast and quality models. Here I’m using GLM-4.7 as an example; simple quick requests go to GLM-4.5-air.
API Request has key fields: Cost, plus four token metrics. Token.In/Out for input/output tokens, Token Cache Read for cache hits.
After API Request comes Tool Decision: which tool to use. Bash, Read, Write, Search, etc. Includes Decision Source/Result — what criteria (config file, user prompt, etc.) led to “approve” or “reject.”
After Tool Decision comes Tool Result. The key tool execution event. Fields include: command, description, error, arguments, user ID, success status.
There are other event types, but these four are the main ones. More details: https://docs.anthropic.com/en/docs/claude-code/monitoring
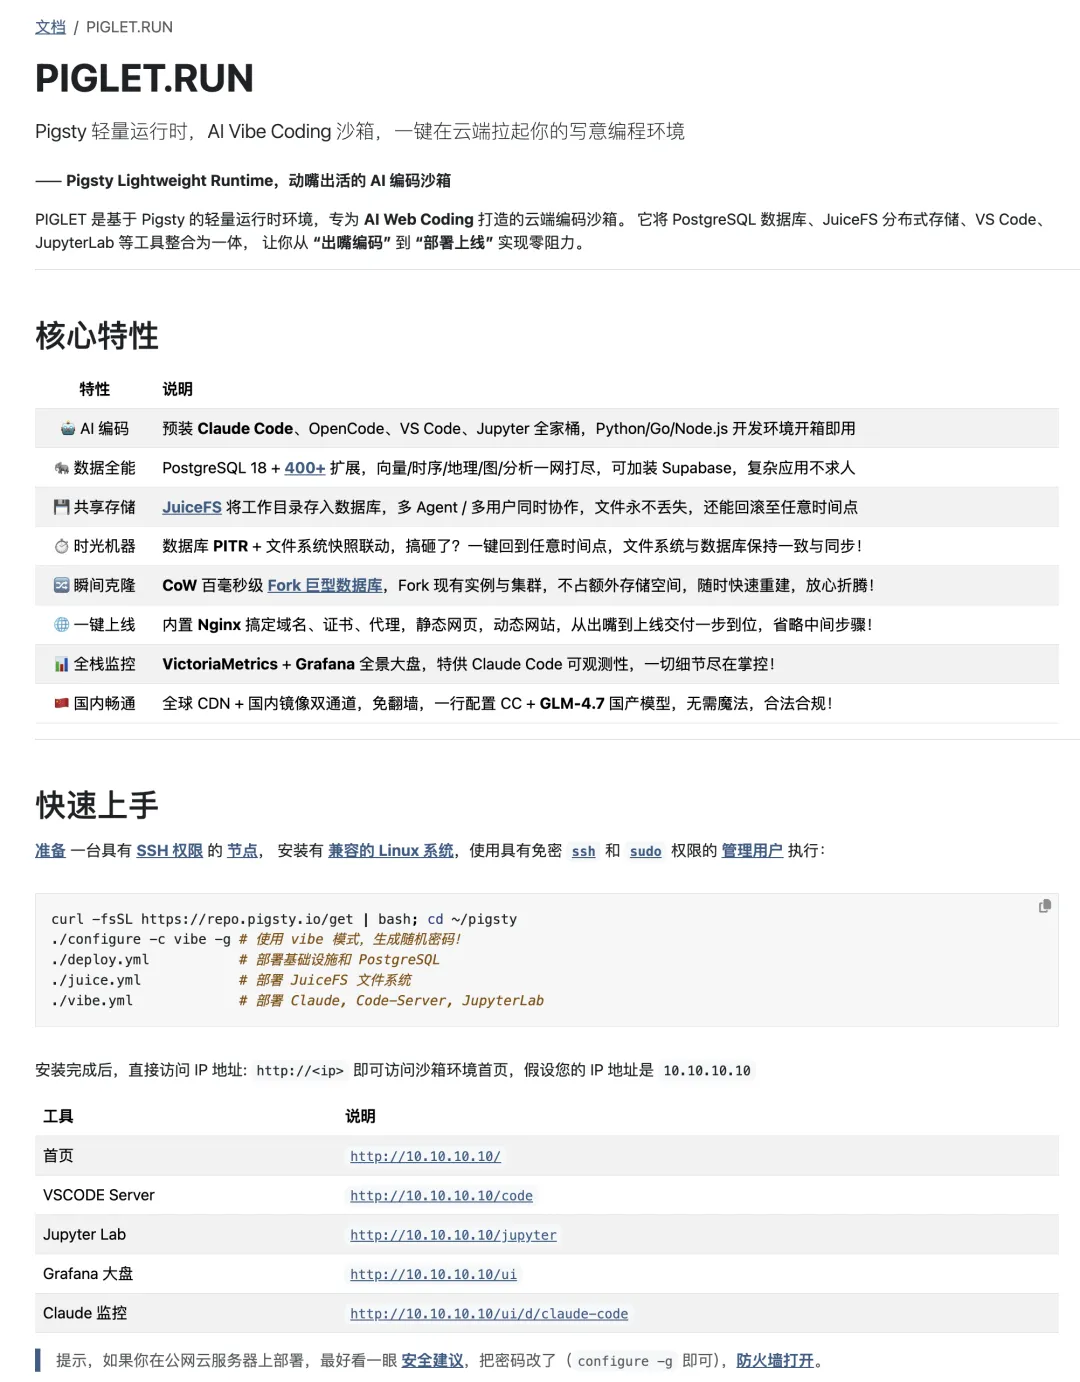
The Sandbox#
“Give a man a fish vs. teach a man to fish” — I know. But theory without a working example is useless. So I built a turnkey sandbox with a complete Victoria monitoring stack and Grafana dashboards. Spin it up on any 1C2G Linux VM in minutes.
Beyond Claude Code monitoring, this sandbox does more. It comes pre-configured with common web coding tools: Claude Code, VS Code, Open Code. Includes PostgreSQL and Nginx. Need a cloud dev environment? This works.
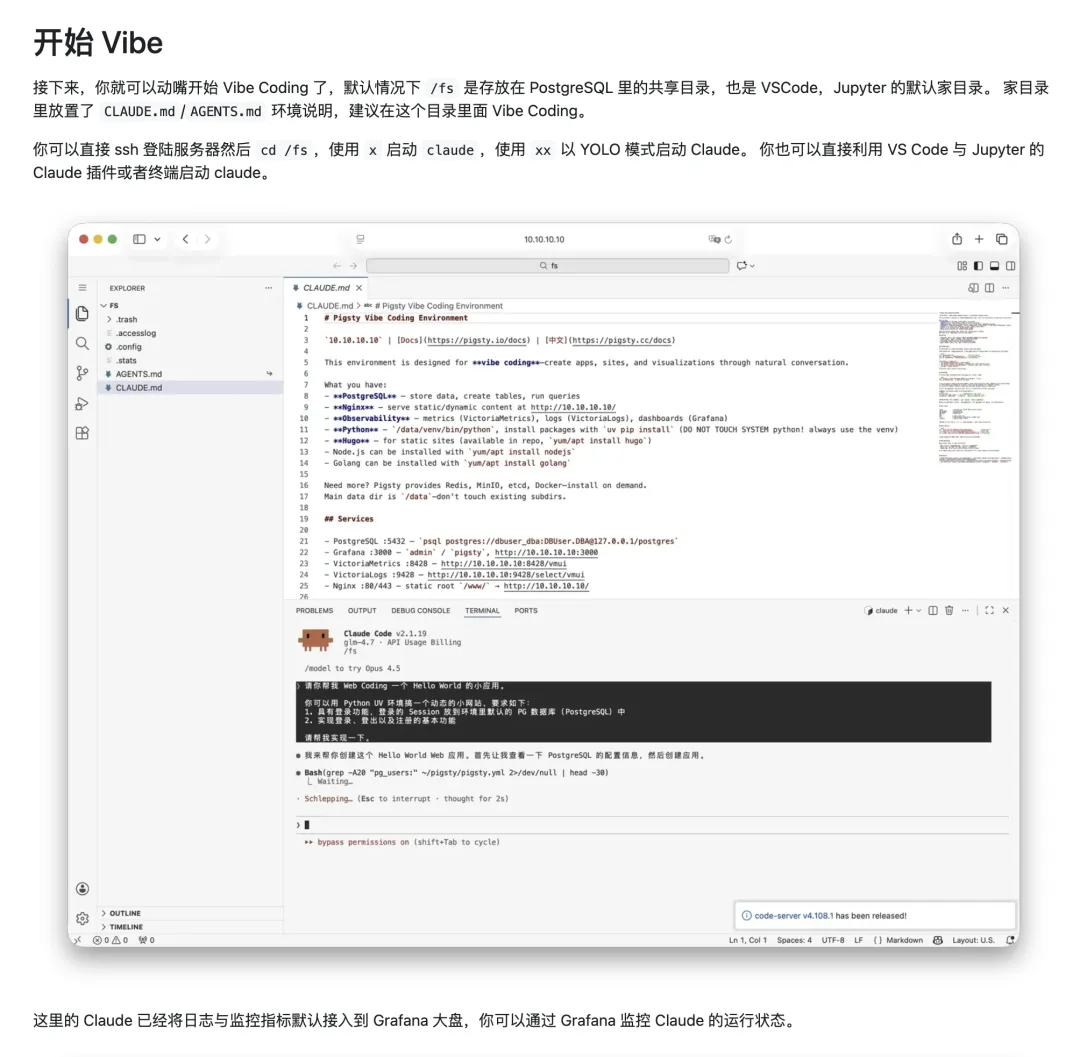
You can also use GLM models without VPN — just add one config line. The beauty of Claude Code: if you’re already using it, you don’t need to sweat the details. Just tell it what you want and let it vibe.
# Switch to other models, e.g., GLM 4.7
claude_env:
  ANTHROPIC_BASE_URL: https://open.bigmodel.cn/api/anthropic
  ANTHROPIC_API_URL: https://open.bigmodel.cn/api/anthropic
  ANTHROPIC_AUTH_TOKEN: your_api_service_token  # Your API key
  ANTHROPIC_MODEL: glm-4.7
  ANTHROPIC_SMALL_FAST_MODEL: glm-4.5-air
The real power of PIGLET.RUN: provide deterministic infrastructure, and Claude Code can handle most of the work. It plays the role of a mid-level DBA or developer — writing code, debugging, testing, deploying. Extremely productive. I’ll write a dedicated DBA Agent post later.