

A reader sent me this story: his RDS MySQL instance underwent two primary/standby failovers in five days. The cloud provider’s explanation was remarkable: its own back-end monitoring had queried the instance to death.
The provider then promised to disable that monitoring that same evening. Four days later, the same instance went down again with the same symptoms.
TL;DR#
- A 32-core, 128 GB RDS MySQL instance underwent primary/standby failovers on July 23 and July 28. Both alert messages gave the reason as “instance exception (instance hang).”
- The provider’s written explanation: an RDS back-end collector queries
information_schema.innodb_trx. Under high concurrency, that query slows down and then blocks DML on the instance, occasionally causing it to hang. After three consecutive health-check failures, HA initiates a failover. - To query this view, InnoDB takes a global exclusive latch that freezes row-lock operations across the entire instance, then walks every connection and every active transaction while holding it. This instance normally had 1,950 open connections.
- The MySQL community fixed a similar problem in 8.0.40, but the fix covered
performance_schema.data_locks. - The provider promised to disable this monitoring feature on the evening of July 24. On July 28, the same instance failed over again with the same symptoms.
- The provider’s own explanation says the feature can fail “when the number of concurrent transactions on an instance is very high,” yet its only proposed remedy was simply to disable it on this customer’s instance.
- Yet that “shutdown” never actually took effect. Four days later, the instance died the same way again.
The Monitoring Query That Made the Database Sick#
This was no toy instance: MySQL 8.0, dedicated instance class, 32 cores, 128 GB of memory, a maximum of 60,000 IOPS, and engine minor version rds_20250731.
It already qualifies as a very large instance, with a monthly price tag to match.

Instance configuration supplied by the contributor. The screenshot establishes the specification and version, but does not by itself prove the cause of the incidents.
On the morning of July 23, the monitoring charts first showed active sessions climbing. At around 09:52, the session count fell off a cliff; the failover alert arrived at roughly the same time.

Sessions, connection utilization, and TPS/QPS on July 23. Values are approximate readings from the screenshot.
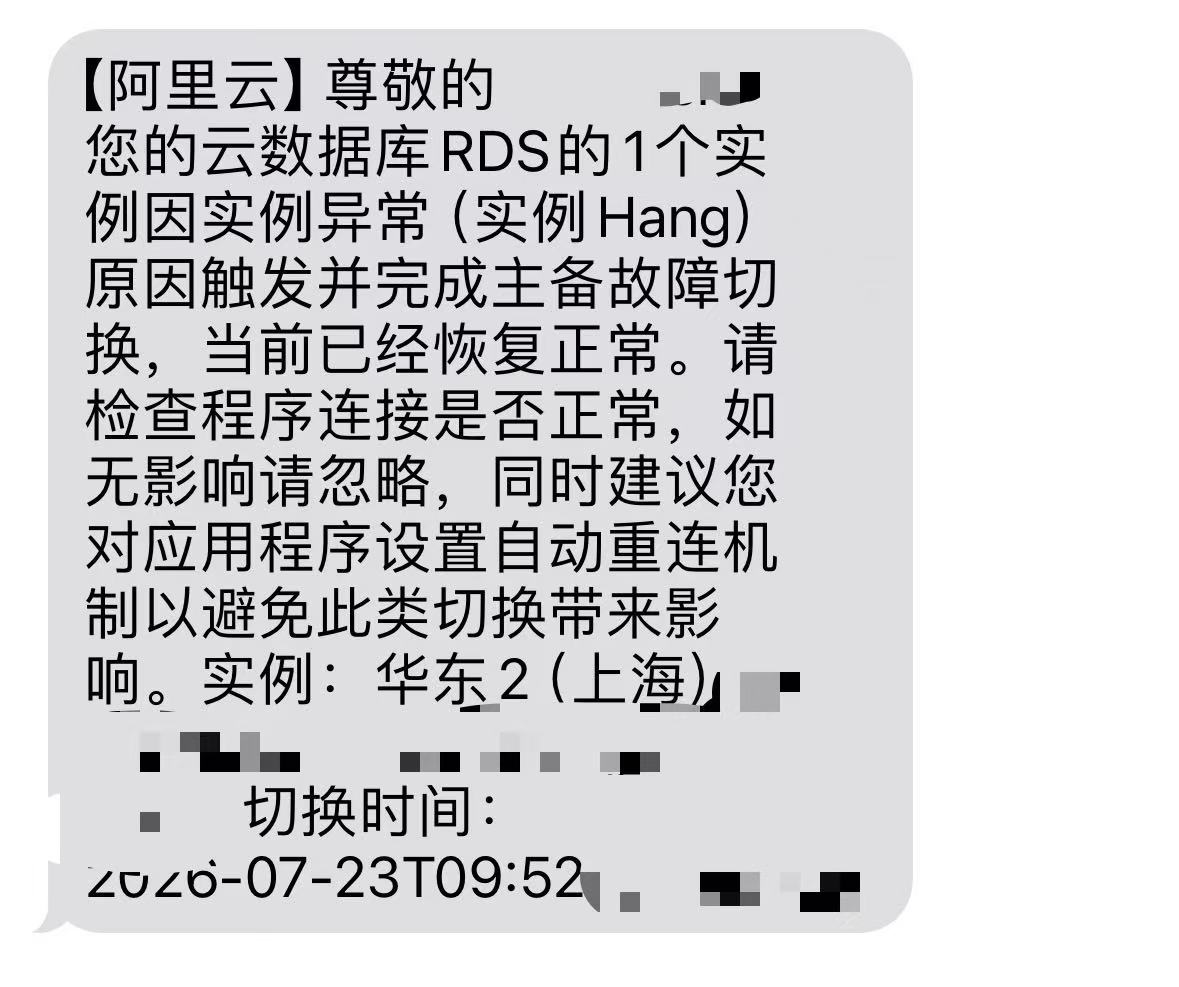
The primary/standby failover alert from July 23. Instance and contact details have been redacted.
The customer asked what had happened and received the written response below. The original contains some grammatical rough edges; I have adjusted only spacing and line breaks:
The Bottom Line: Monitoring Must Not Change the System It Monitors#
That sounds obvious, but enforcing it has an implementation cost, and that cost must be paid at design time.
I work on PostgreSQL and have never been particularly interested in tinkering with the MySQL stack. But the principles of monitoring are universal and quite simple: monitoring exists to help maintain a system, not to bring it down. The priorities cannot be reversed.
When I built Pigsty’s monitoring system, I imposed three hard rules.
First, collect every 10 seconds. Collecting once a second certainly makes prettier charts, finer-grained metrics, and clearer incident reconstruction. But I consider 10 seconds the right level of pressure. This is a production database, not a lab bench.
Second, every monitoring query gets a hard timeout: 100 milliseconds. When time is up, kill it, whether or not it returned anything. One missing point on a chart is harmless. One extra cascading failure is not.
Third, and strictest of all: the sum of all hard query timeouts must be shorter than one collection interval. Then, even in the worst case—every query timing out—the collector merely burns one empty cycle. It can never accumulate work and can never drag the system down.
This is not sophisticated design. It is basic arithmetic. But I wrote the rule only after seeing a production database taken down by its own monitoring.
So I did not find this case infuriating at first. I found it absurd. A cloud vendor that sells monitoring as a product tripped over this exact problem. It then wrote a technically competent analysis and promised corrective action— only to fall into the same hole twice in five days.
The remaining lessons are at the end. First, the story.
1. July 23, 09:52#
Again, this was no undersized instance: MySQL 8.0, dedicated instance class, 32 cores, 128 GB, and a maximum of 60,000 IOPS.
Its engine minor version, rds_20250731, was about a year old;
the minor-version upgrade policy was set to manual.
The morning’s sequence is clear in the charts:
- The normal session count hovered around 1,950, while connection utilization stayed below 5%. Connections were never the bottleneck.
- At around 08:50 there was a rehearsal: sessions surged to 2,400, active sessions briefly rose, then both receded without an incident.
- The second act began at 09:45. Active sessions shot up to around 250. With 250 active sessions on 32 cores, the system was oversubscribed nearly eight to one and work began to queue. Metadata lock waits appeared, a common secondary symptom when the whole system stalls, and QPS peaked near 20,000.
- 09:52: the cliff. The session count dropped vertically from 2,000 to 570. That was the instant of the primary/standby failover, which severed every connection at once.
Then came the long climb back. It took roughly 40 minutes for the session count to recover from 570 to 1,600, and QPS remained markedly below its pre-incident level for quite some time.
The text message said, “Service has now returned to normal.”
The customer asked why. The provider replied in writing:
RDS has a back-end monitoring feature that collects information about active database transactions by querying the MySQL system view
information_schema.innodb_trx. When the number of concurrent transactions on your instance is high, lock contention can block queries against the system viewinformation_schema.innodb_trx, while slower queries against the system view can in turn further block DML operations in the database, occasionally causing the instance to hang. HA health checks then fail, and a failover may be triggered after three consecutive instance health-check failures.
Frankly, the candor of this answer exceeded my expectations. For a Chinese cloud vendor to put “our own back-end monitoring brought down your instance” in writing is rare.
But one sentence is twisted: “lock contention can block queries against the system view.”
That reverses cause and effect.
A query against innodb_trx does not request row locks, so row locks do not block it.
What actually happens is this: the query’s cost rises sharply as concurrency and lock contention increase,
and it pays that cost while holding a global latch.
The first version makes it sound as if the customer’s workload blocked the monitoring system. The second identifies a defect in the monitoring implementation itself. That distinction matters.
2. Why “Just Taking a Look” Costs So Much#
information_schema.innodb_trx looks like a table, but it is not one.
It is a snapshot generated at query time:
InnoDB must pause, scan the current transaction state into an internal cache,
and then return the cache contents to the caller.
I pulled the source. The heart of storage/innobase/trx/trx0i_s.cc is this:
int trx_i_s_possibly_fetch_data_into_cache(trx_i_s_cache_t *cache)
{
  if (!can_cache_be_updated(cache)) {
    return (1);
  }
  {
    /* We need to read trx_sys and record/table lock queues */
    locksys::Global_exclusive_latch_guard guard{UT_LOCATION_HERE};
    trx_sys_mutex_enter();
    fetch_data_into_cache(cache);
    trx_sys_mutex_exit();
  }
  return (0);
}
The Latch#
The crucial line is Global_exclusive_latch_guard: a global exclusive lock-system latch.
lock_sys is the center of InnoDB’s lock system.
Any transaction that needs to acquire or release a row lock, or perform deadlock detection, must pass through it.
MySQL 8.0 went to considerable effort to shard this latch so concurrent transactions would not trip over one another.
The original comment above this code says:
/* We are going to iterate over many different shards of lock_sys so we need
exclusive access */
In plain English: I need to inspect every shard, so I am taking exclusive control of the whole thing. This code path voluntarily gives up the sharding work done in 8.0.
While that latch is held exclusively, no transaction anywhere on the instance can acquire or release a row lock. Everything stops.
How Long the Latch Is Held#
fetch_data_into_cache() walks two lists:
trx_sys->rw_trx_list, containing read-write transactions, and trx_sys->mysql_trx_list,
which is roughly “every still-connected session that has ever touched InnoDB.”
To be fair, connections on that list that have not begun a transaction are skipped quickly rather than taking the full path. Even so, the loop must visit every item in the list and enter and leave every transaction’s mutex one by one. For every transaction that has started, it also does this:
char query[TRX_I_S_TRX_QUERY_MAX_LEN + 1];
stmt_len = innobase_get_stmt_safe(trx->mysql_thd, query, sizeof(query));
It reaches into that connection’s THD, takes its query lock, copies up to 1,024 bytes of the SQL currently being executed, and counts the rows locked by the transaction.
So the cost of “taking a quick look at what the database is doing” has two components: a traversal proportional to the total number of connections, plus deep-copy work proportional to the number of active transactions— all performed under the exclusive latch that freezes row-lock operations across the instance.
This instance had 1,950 connections. At the time of the incident, it had 250 active sessions.
Under normal conditions, the work may finish in tens of milliseconds. But when active sessions surge and lock queues grow, there are more transactions to copy, more lock information to read from each transaction, and contention even for each THD’s query lock. Tens of milliseconds become hundreds, then seconds.
The feedback loop is now complete:
high concurrency → slower snapshot copy → global latch held longer → all DML stops
                 → transactions pile up during the stall → next copy is slower → …
This is not linear degradation. It is a cascading failure.
About Those 100 Milliseconds#
can_cache_be_updated() contains a hard-coded 100-millisecond window.
The source comment explains its purpose clearly:
it lets a SQL statement that joins several related views read a consistent snapshot.
It is not a rate limiter for collectors. For any normal polling interval—one second, five seconds, or 10 seconds— the cache might as well not exist. Every poll rebuilds the snapshot from scratch.
An Old Trap on an Unfixed Path#
The MySQL manual warned more than a decade ago that because InnoDB must pause temporarily while collecting transaction and lock data,
querying these tables too frequently can degrade the performance experienced by other users.
The official bug tracker contains a string of related reports:
#100537, #111082, #113761, #104367, #112035, and #109539—
all variations on “querying a lock view hangs the instance.”
Oracle did fix the problem.
In MySQL 8.0.40, released in October 2024, it redesigned performance_schema.data_locks
and data_lock_waits so they no longer required a global exclusive mutex.
But the fix applied to those two Performance Schema tables.
information_schema.INNODB_TRX still follows the old path shown above.
I compared trx0i_s.cc in 8.0.32, 8.0.40, and 8.4.3.
Not one word of this code changed,
and Global_exclusive_latch_guard is still sitting there in 8.4.
One qualification is essential: I compared the MySQL Community source. Alibaba Cloud runs its own AliSQL. I do not know whether it modified this path, or how; there is no way to determine that from outside. I can confirm only this: through the 8.4 community baseline, this code remains unchanged.
The community spent years repairing the new path while leaving the old one untouched. This newly deployed collector chose the old path.
3. July 28, 17:19#
Four days later, the same instance generated the same text message.
The charts looked worse this time:
- At around 17:13, the number of InnoDB dirty pages rose from 95,000 to 100,000.
- At roughly 17:14:30, the dirty-page graph dropped vertically to zero. For the next 15 minutes, only a few scattered samples appeared.
- At 17:15:45, the fsync count surged from a baseline of 10–30 to 590. At 17:20:45 it surged again, to 535.
- At around 17:29:30, the dirty-page count began climbing again from zero.
A dirty-page count does not drop to zero by itself. Either the pages were flushed clean, or the instance was no longer serving normally— it had stopped responding or restarted outright.
My reading is the latter. A successful flush should produce a downward slope, not a vertical cliff. Nor should the graph lie at zero for 15 minutes with only a few intermittent points. That pattern indicates failed collection, not successful flushing.
On that reading, the actual impact window was: 17:14, instance stops responding → 17:19, text message says failover completed → 17:29, new primary resumes normal writes— roughly 15 minutes.
What did the text message say again? “Service has now returned to normal. If there was no impact, please ignore this message.”
One Absurd Number, by the Way#
While the customer was still investigating the second incident, he briefly leaned toward another explanation: write pressure rose, dirty pages accumulated, flushing could not keep up, and the checkpoint fell behind. The suspected cause was that “the RDS platform’s conservative default configuration did not match a 128 GB, 60,000-IOPS instance.”
That hypothesis is entirely plausible.
If the innodb_io_capacity family of parameters retains conservative values from the spinning-disk era,
the page cleaner deliberately throttles itself.
Even if the underlying storage can deliver 60,000 IOPS, it may refuse to flush more than 2,000.
This is a classic MySQL failure mode.
The evidence supporting this line of inquiry was one number on the IOPS chart: during the incident, IOPS utilization peaked at about 15.7%.
At a 60,000-IOPS allowance, the database used fewer than 10,000 IOPS even at the peak. The disk had more than 80% of its capacity sitting idle while the database failed to flush and locked up.
4. “Expected to Be Completed Tonight”#
Now read the provider’s proposed remediation in full:
In the vast majority of cases, the monitoring feature described above has no significant impact on instance performance, but the issue may occur when the number of concurrent transactions on an instance is very high. We can configure this feature to be disabled on the customer’s instance. This is expected to be completed tonight (July 24). Disabling it will have no impact on the customer’s use of the instance.
Two words in that paragraph deserve separate attention.
First: “Expected”#
When an incident remediation says “expected,” the loop has not been closed— there is no confirmation, no acknowledgment, and no verification.
What did the customer think at the time? In the contributor’s own words: “It should have been disabled.”
“Expected” meets “should.” Across the entire remediation process, neither side knew for certain.
Second: “No Impact”#
“Disabling it will have no impact on the customer’s use of the instance.” This was meant as reassurance: disabling the feature would have no side effects.
Read after July 28, however, it becomes accidental black comedy:
Indeed, it had no impact—if they never disabled it at all.
Four Possibilities, None Respectable#
The contributor later sent me this message:
The investigation has mostly reached a conclusion. The root cause is exactly what they described in their first response. For the second failover, I don’t know whether they were overconfident or assumed it was a one-off, but they said they would disable that monitoring and did not actually do it. This is amateur hour.
I need to be precise about the status of that statement: it is the contributor’s account of the investigation’s conclusion, not a public statement from the provider. As of publication, the formal report on the second incident had not been issued. I cannot verify whether the shutdown was attempted, whether it succeeded, or whether the feature they disabled was actually responsible.
I therefore will not treat that statement as this article’s conclusion. Instead, let us enumerate every plausible explanation for the July 28 failover and examine each one.
Possibility one: the shutdown was never performed. Then the promise meant nothing.
Possibility two: it was performed but failed, or it disabled only part of the feature or only one node. Then the promise was acted on, but nobody went back to verify the change. An unverified fix is no fix at all.
Possibility three: it was performed and succeeded, but the disabled feature was not the culprit. Then the July 23 root-cause analysis was wrong. The provider spent time writing a technically competent explanation, formally committed to a remediation, and then fixed something unrelated to the incident.
Possibility four: it was performed, succeeded, and the attribution was correct, but July 28 had a completely new and independent cause.
This is the only explanation that clears the provider of repeating the same monitoring failure. It is also the ugliest of the four.
It would mean that the same instance independently hit two different platform-level defects within five days: one back-end collector froze the instance while holding a global latch, and one set of defaults was sized for spinning disks on storage capable of 60,000 IOPS. That is not bad luck. That is a minefield.
All four roads lead to the same place: not one part of this process was rigorous from beginning to end.
The Worst Part Is Not That It Failed Again#
It failed in the same place.
This was not another customer on the platform encountering a new problem. It was the same instance, the same customer, and the same problem that had already been filed, analyzed, and assigned corrective action— recurring against the same victim.
A competent SRE team has a name for this: a repeat incident, one of the least tolerable classes of incident. It does not prove “we encountered a hard problem.” It proves “our corrective-action loop was fiction.”
And how was that fiction discovered?
The customer’s production environment blew up again.
I see no evidence that anyone proactively verified whether the fix had taken effect. What I can see is that its failure was discovered through a 15-minute business interruption. The formal report on the second incident was still unavailable at publication; for now, this comparison of the two incidents is something the customer assembled independently.
From the customer’s side, not one stage—the promise, the failed fix, its discovery, or the postmortem—was proactively driven by the other party.
And the Mine Is Still Buried in Other Databases#
Now return to the first half of the provider’s statement:
In the vast majority of cases, the monitoring feature described above has no significant impact on instance performance, but the issue may occur when the number of concurrent transactions on an instance is very high.
That is the platform operator’s own written acknowledgment: this is not unique to one customer. It is a general defect. Any instance with enough concurrent transactions is within the blast radius.
And the remedy?
We can configure this feature to be disabled on the customer’s instance.
Those last four words matter: on the customer’s instance.
At least in this response, the remediation scope goes no further— disable it for the customer who has already made enough noise. I have no way to know whether the collector’s implementation was changed across the service, and I found no related announcement. If anyone knows more, please add it in the comments.
But if it was not changed globally, the implication is stark: this collector is still running on every other RDS MySQL instance with high transaction concurrency. Unless you complain, it will keep taking that global latch inside your database.
The owners of those instances do not even know it exists.
5. A Switch That Was Bypassed#
As noted earlier, this instance’s minor-version upgrade policy was set to manual.
That expresses a clear intent: do not touch my database engine without my approval. So the engine remained on the release from a year earlier. The red exclamation mark beside “Upgrade engine minor version” stayed lit in the console, and the customer left it alone.
Many veteran DBAs avoid chasing new releases on production databases. That choice is neither inherently right nor wrong.
The question is: how did the collector that brought down the instance get there?
Even the contributor called the monitoring “unknown.” After all this investigation, he still did not know which product line it belonged to, what feature it was, or when it had been deployed. He could not even find the monitoring query in the logs.
Someone may object: engine minor-version upgrades use one channel, while back-end collectors use another. Do not conflate them.
Correct. That is exactly the point.
The customer thought he had disabled “changes made without my consent.” In reality, he had disabled only the one channel he could see. The other had no switch, and no page in the console even disclosed that it existed.
You can refuse only what you can see.
6. Who Actually Pulled the Plug?#
We now have two suspects: the workload’s high concurrency and the platform’s collector. But a third party turned “slow” into “offline.”
One sentence from the contributor made me read it three times:
The workload was actually still running, just slowly. But the new monitoring they recently deployed checked the instance’s state, made it even slower, and then triggered a primary/standby failover.
The chain looked like this: workload running, but slow → health check cannot get through → three consecutive failures → primary/standby failover → total outage.
The original failure mode was partial degradation: slow but alive, with connections still open and requests still returning, so upstream systems could continue coping. The high-availability mechanism escalated it into a complete outage— every connection severed at once, connection pools collapsing, retries storming upstream, followed by a 40-minute climb back.
“Three consecutive health-check failures” is itself a deeply questionable criterion when the instance is hung rather than dead.
A failed probe does not mean the instance is dead. To the probe, an instance blocked on a global latch looks just like a missing process, but the correct response to each is entirely different.
More importantly, a failed probe does not mean failover will improve matters. The new primary has a cold buffer pool, while the business workload is unchanged and the back-end collector is unchanged. You move a sick patient, unchanged chart and all, to the next bed, then hope the illness will somehow stay behind.
The July 28 charts supplied the answer: after the failover, the new primary’s dirty-page count started climbing from zero and took nearly 20 minutes to recover to half its previous level.
High availability did not preserve availability here. It was the day’s single largest availability expense.
7. If There Was No Impact, Please Ignore This#
Finally, read the text message again:
One of your Cloud Database RDS instances triggered and completed a primary/standby failover due to an instance exception (instance hang). Service has now returned to normal. Please verify that your application’s connections are healthy. If there was no impact, please ignore this message.
“Due to an instance exception.” What caused the exception? An exception. The actor has been elegantly omitted. Not “our collector hung your instance,” but “instance exception,” as if the machine had simply suffered a spell— a natural phenomenon, like the weather.
“Service has now returned to normal.” On July 28, “now” meant 15 minutes later.
“If there was no impact, please ignore this message.” This is the finest line of all. It neatly transfers the burden of proof to the customer: you go check whether there was any impact. If you fail to find it, then there was none.
I understand perfectly why the template is written this way. No one can customize alerts individually for hundreds of thousands of instances. But precisely because it is a template, it reveals the deeper assumption: in this system’s worldview, “your database just died once” is something that can be ignored by default.
The contributor’s verdict was simple: amateur hour.
I cannot think of a more accurate description.
Epilogue: You Outsourced the Complexity, Not the Risk#
To be fair, this is not unique to one cloud provider.
I have seen plenty of self-hosted monitoring systems hammer information_schema.innodb_trx;
configuring innodb_io_capacity for spinning disks on NVMe is more common still.
The whole world knows this trap—
the MySQL manual documents it, AWS documents it, Google Cloud documents it,
and the bug tracker contains a whole series of reports.
Everybody knew about the trap except the newly deployed collector.
Nor is the real point that “cloud is bad.” Cloud platforms can take over 99% of the complexity. That is real value.
The point is this: you outsourced the complexity, but the risk stayed with you.
The risk was always yours. When the business goes down, it is your business that is down. Your users wait through the 40-minute recovery, and your orders disappear during the 15-minute outage. What you outsourced was only your ability to see the problem, understand it, and intervene.
That leaves you in the position of the customer in this case: you selected manual engine upgrades, yet a collector you had never heard of arrived through another channel; you paid for 60,000 IOPS, yet did not control the parameter that decided how many could be used; a global exclusive latch froze your instance, yet you could not discover who was holding it; the provider promised corrective action, and the same thing happened again four days later, while you had no way to verify whether the fix had ever been applied.
In the end, you received a text message telling you to ignore it if there was no impact.
The most underrated value of open-source, self-hosted infrastructure has never been saving money. It is the right to know— when something breaks, you can at least open the hood yourself and see what is actually happening inside.
Appendix: Three General Rules#
1. When collecting transaction and lock information, prefer Performance Schema.
Do not query information_schema.innodb_trx at high frequency.
Since 8.0.40, performance_schema.data_locks no longer needs the global exclusive latch,
while the old INNODB_TRX path remains unchanged through 8.4.
If you need only long-running transactions, Performance Schema’s transaction event tables and the counters in innodb_metrics
are both better options than copying the entire snapshot.
2. Before adding any collection operation, ask two questions:
What locks does it run under? What is its computational complexity?
Then add one safety net:
give every query a hard timeout, and make the sum of all timeouts shorter than the collection interval.
A collector that performs O(N) work under a global exclusive latch with no timeout
is not monitoring. It is load testing.
3. A health-check statement must be the lightest query in the world, and it must distinguish “slow” from “dead.” A health check asks whether the machine can still work, not whether it is working quickly. A probe that the business workload can overwhelm does not measure the database’s health. It measures its mood. And before pulling the plug, always ask one more question: will failing over really make things better?
This article is based on a reader submission. Factual claims come from alert messages, written correspondence, and monitoring screenshots supplied by the contributor; the provider’s explanation is quoted from the original. The customer’s investigation findings are the contributor’s account, and the formal report on the second incident had not been issued as of publication. This article makes no determination of responsibility; interpretations and commentary are my personal opinions based on the materials described above, and are identified as such in the text. Source excerpts come from the public MySQL repository. Alibaba Cloud’s actual AliSQL implementation may differ.